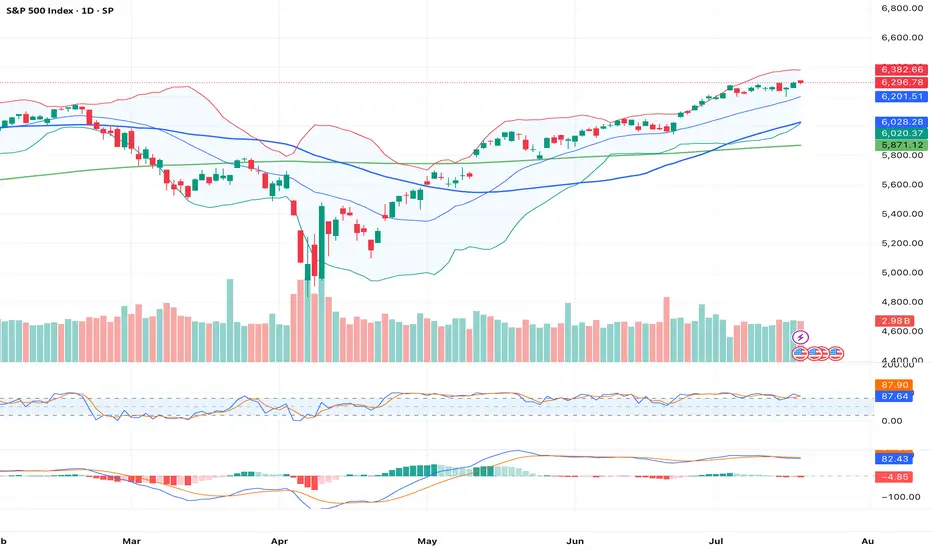
This chart represents the 1-day (Daily timeframe) price action of the S&P 500 Index (SPX), offering a focused view of market sentiment, key levels, and trend momentum as of [Today’s Date]. Each candlestick reflects a full trading day.
📊 Chart Parameters:
Instrument: S&P 500 Index (SPX)
Timeframe: 1D (1-Day)
Exchange: NYSE / NASDAQ Composite (tracked as index)
Date Range Displayed: Past 3–6 months (approx.)
📊 Chart Parameters:
Instrument: S&P 500 Index (SPX)
Timeframe: 1D (1-Day)
Exchange: NYSE / NASDAQ Composite (tracked as index)
Date Range Displayed: Past 3–6 months (approx.)
免责声明
这些信息和出版物并不意味着也不构成TradingView提供或认可的金融、投资、交易或其它类型的建议或背书。请在使用条款阅读更多信息。
免责声明
这些信息和出版物并不意味着也不构成TradingView提供或认可的金融、投资、交易或其它类型的建议或背书。请在使用条款阅读更多信息。