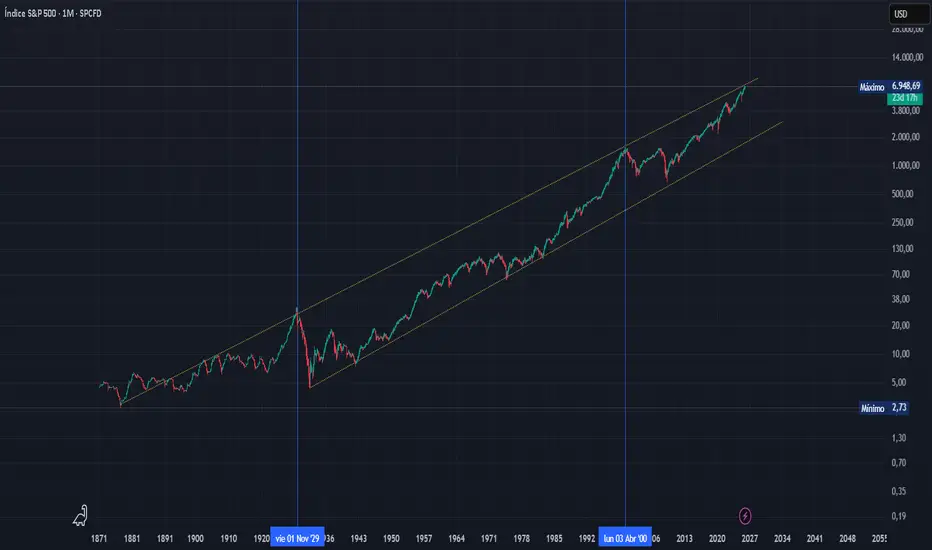
S&P 500 Monthly – Historical Logarithmic Chart –
The S&P 500 is approaching long-term resistance seen in 1929 and 2000.
In log scale, this represents limits to sustained percentage growth, highlighting elevated valuations and potential caution.
Historically, similar levels have led to deep corrections, sideways consolidation, or rare breakouts.
Key takeaway : At this stage, disciplined caution and selective positioning tend to generate better long-term alpha than chasing broad market gains.
免责声明
这些信息和出版物并非旨在提供,也不构成TradingView提供或认可的任何形式的财务、投资、交易或其他类型的建议或推荐。请阅读使用条款了解更多信息。
免责声明
这些信息和出版物并非旨在提供,也不构成TradingView提供或认可的任何形式的财务、投资、交易或其他类型的建议或推荐。请阅读使用条款了解更多信息。