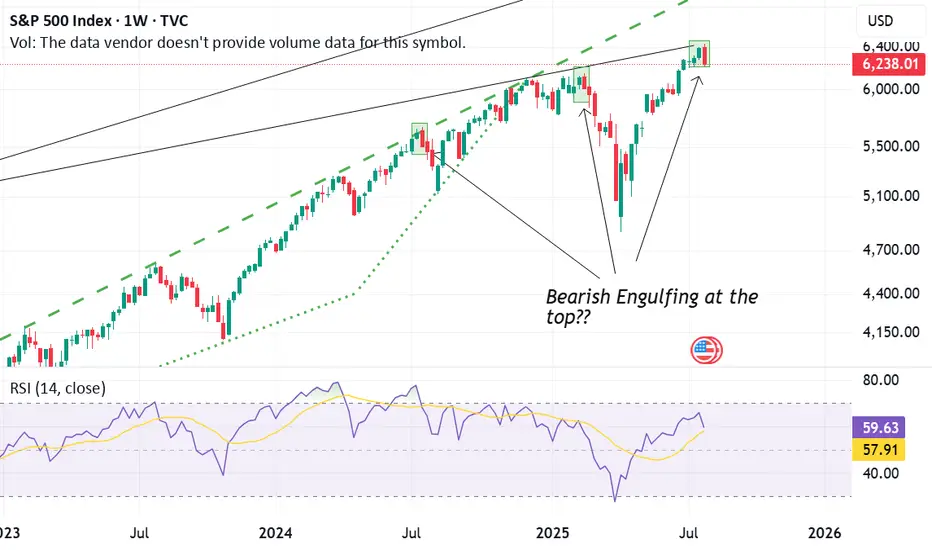
Last week, the S&P 500 Index (SPX) printed a bearish engulfing candle on the weekly chart. This candlestick pattern occurs when a larger red (bearish) candle completely "engulfs" the body of the previous green (bullish) candle. It is a classic reversal signal, often indicating that the momentum may be shifting from bullish to bearish.
What makes this significant is the recurring pattern we've observed:
At each of the last three market tops, the SPX formed a bearish engulfing pattern—and each time, this was followed by a notable correction or pullback.
The current candle mirrors those past setups almost identically, suggesting that the market may again be vulnerable to a short-term decline.
However, the big question remains:
"Will this time be different?"
In short, the bearish engulfing pattern is a warning sign—especially given its historical reliability at tops—but confirmation is key.
Ask ChatGPT
注释
Confirmation did not come next week that negates the downside view...Apologies for the late update免责声明
这些信息和出版物并非旨在提供,也不构成TradingView提供或认可的任何形式的财务、投资、交易或其他类型的建议或推荐。请阅读使用条款了解更多信息。
免责声明
这些信息和出版物并非旨在提供,也不构成TradingView提供或认可的任何形式的财务、投资、交易或其他类型的建议或推荐。请阅读使用条款了解更多信息。