are always important later. click the "add more candles" blue arrow
注释
if it populates after publishing and provides one注释
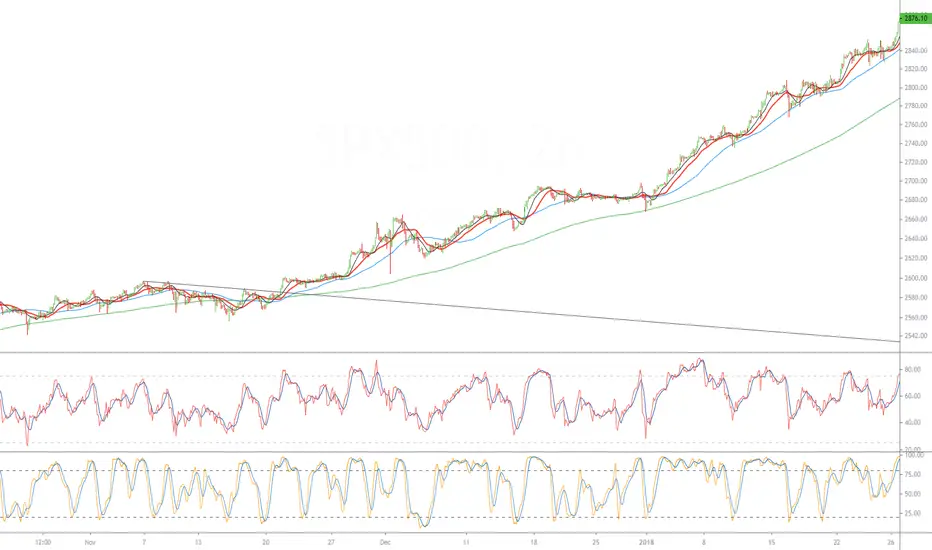
it didnt give me the blue arrow, but you can click and drag the chart to the left to show future candles and see the result. the point is to watch for these kinds of break outs (you can see how important that break out was by how far it went) and keep the line on your chart or be able to pick out the break out later and draw it in.注释
and if you think that is crazy, extend the same line to christmas 2018.免责声明
这些信息和出版物并非旨在提供,也不构成TradingView提供或认可的任何形式的财务、投资、交易或其他类型的建议或推荐。请阅读使用条款了解更多信息。
免责声明
这些信息和出版物并非旨在提供,也不构成TradingView提供或认可的任何形式的财务、投资、交易或其他类型的建议或推荐。请阅读使用条款了解更多信息。