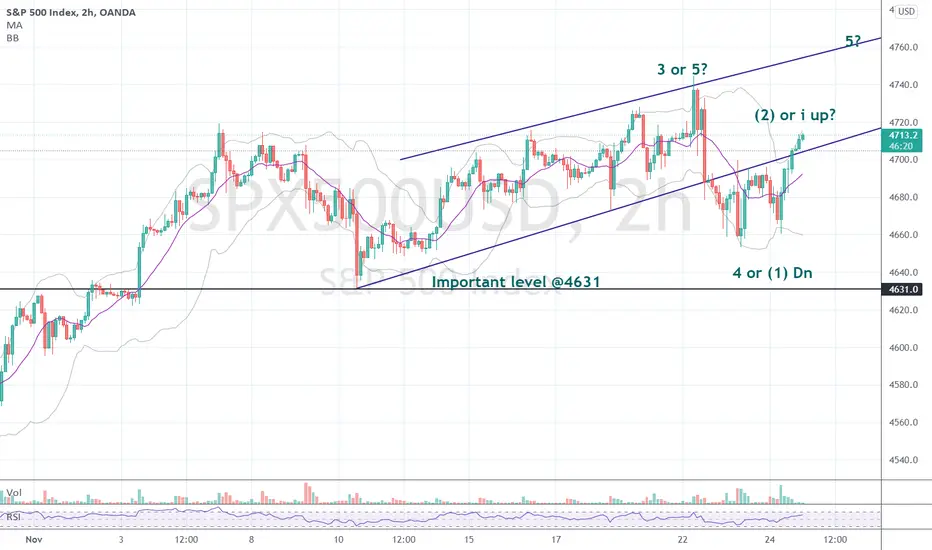
Long held trends tend to hold-up, well... long. I've labeled the chart with 2 of what I think are the most plausible EW count scenarios. It does allow to see where the risk and acceleration levels likely are. Only time will tell if the top is in, or if we are going still higher yet.
交易开始
At time of writing the SPX500 has dropped substantially. So the bear market count comes into play. Have said that the current shape of the downturn could also be interpreted as an ABC and the correction could end soon. The next few trading days will clear up the picture.免责声明
这些信息和出版物并不意味着也不构成TradingView提供或认可的金融、投资、交易或其它类型的建议或背书。请在使用条款阅读更多信息。
免责声明
这些信息和出版物并不意味着也不构成TradingView提供或认可的金融、投资、交易或其它类型的建议或背书。请在使用条款阅读更多信息。