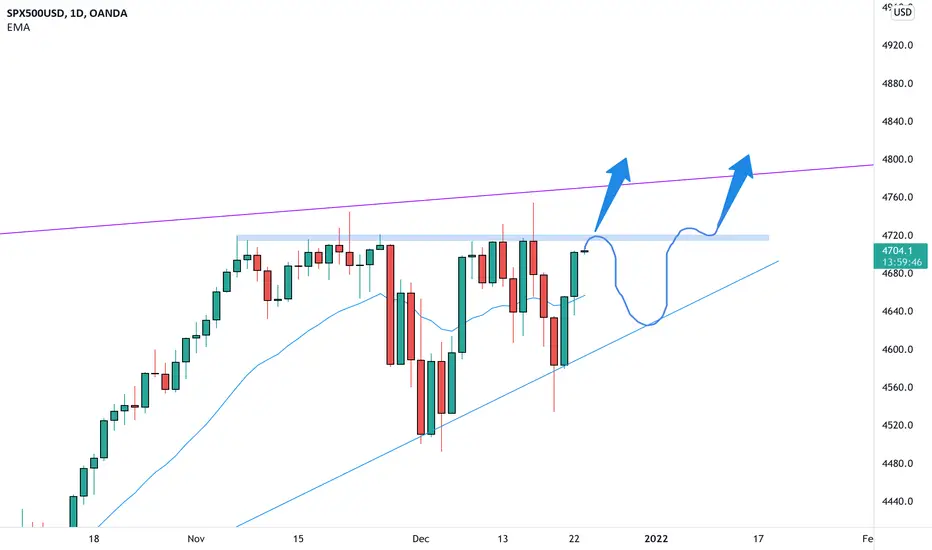
SP500 on the daily chart is trading between an ascending trendline and a daily resistance.
The price is now moving to the upper structure and we can see 2 possible scenarios where one is a rejection and the continuation in a possible triangle pattern.
The other is the break above with the consequent new ath.
––––
Follow the Shrimp 🦐
Keep in mind.
• 🟣 Purple structure -> Monthly structure.
• 🔴 Red structure -> Weekly structure.
• 🔵 Blue structure -> Daily structure.
• 🟡 Yellow structure -> 4h structure.
• ⚫️ Black structure -> >4h structure.
Here is the Plancton0618 technical analysis , please comment below if you have any question.
The ENTRY in the market will be taken only if the condition of the Plancton0618 strategy will trigger.
注释
注释
注释
注释
ATH 注释
注释
NEW ATH 注释
免责声明
这些信息和出版物并不意味着也不构成TradingView提供或认可的金融、投资、交易或其它类型的建议或背书。请在使用条款阅读更多信息。