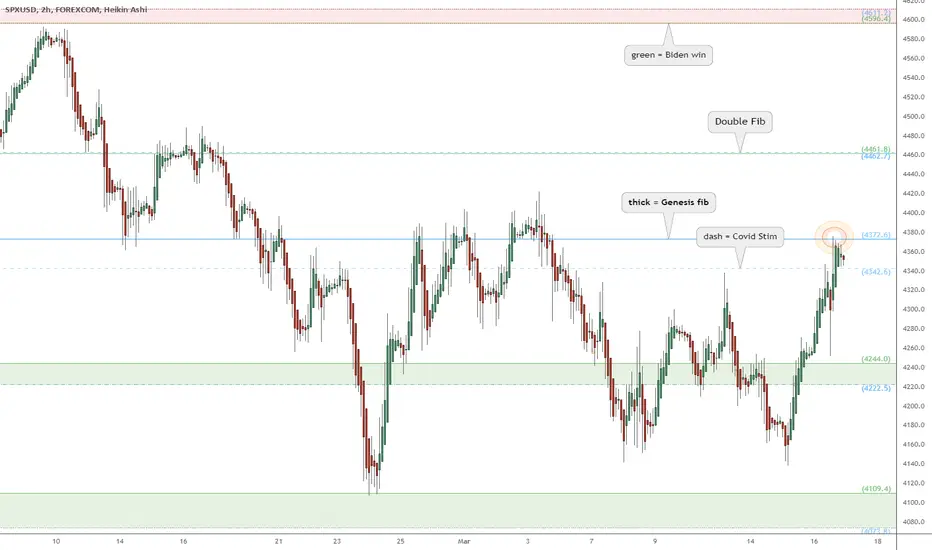
Plotted are 3 different sets of Fibonacci Extensions.
Each fib is like a "ruler" calibrated to a specific wave.
Every level is relevant, especially the confluence zones.
4372.6 is the key level to break and hold as bottom marker.
4343.6 is immediate support that strong bull would hold.
4222-4224 is key support for bulls to defend as a higher low.
4073-4019 should have been the bottom and NOT be retested.
The origin of the above fibs are shown in this DAILY View (click).
.
the Golden Ratio is my Religion
the Trading View is my Nation
the Moderator Tag is my Flag
the Trading View is my Nation
the Moderator Tag is my Flag
相关出版物
免责声明
这些信息和出版物并不意味着也不构成TradingView提供或认可的金融、投资、交易或其它类型的建议或背书。请在使用条款阅读更多信息。
the Golden Ratio is my Religion
the Trading View is my Nation
the Moderator Tag is my Flag
the Trading View is my Nation
the Moderator Tag is my Flag
相关出版物
免责声明
这些信息和出版物并不意味着也不构成TradingView提供或认可的金融、投资、交易或其它类型的建议或背书。请在使用条款阅读更多信息。