Shriram Transport Finance (D) - Head & Shoulders Chart Pattern
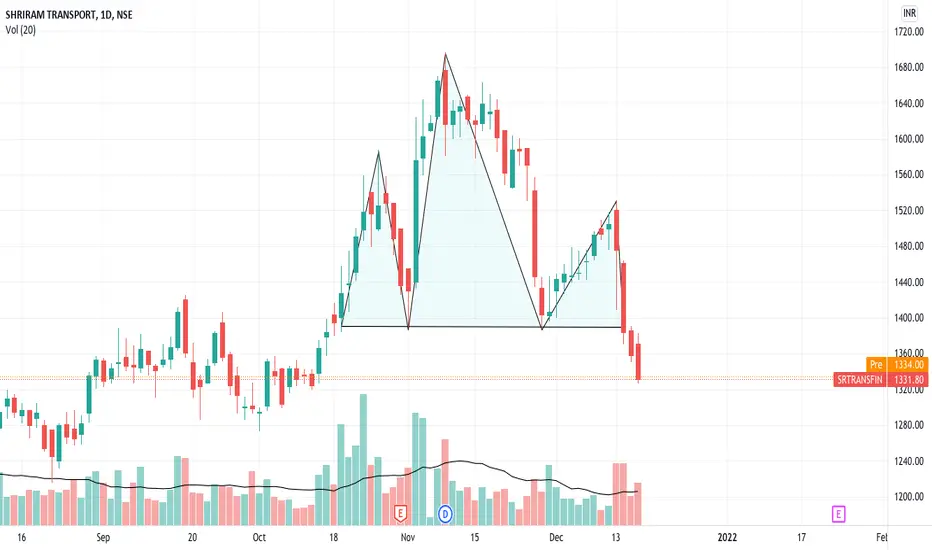
Shriram Transport Finance (Daily)
Head & Shoulders Chart Pattern
Lower bollinger band is challenged
MACD of the daily wave and weekly tide is downtick
RSI is below 40 in the oversold zone
Stochastic 14,3,3 is in negative crossover and oversold zone
-DI is above +DI and ADX is above 15 in the Directional Movement Index (DMI)
Seems to be in the C wave currently
Look for the next major support below on the chart as Target 1
免责声明
这些信息和出版物并不意味着也不构成TradingView提供或认可的金融、投资、交易或其它类型的建议或背书。请在使用条款阅读更多信息。
免责声明
这些信息和出版物并不意味着也不构成TradingView提供或认可的金融、投资、交易或其它类型的建议或背书。请在使用条款阅读更多信息。