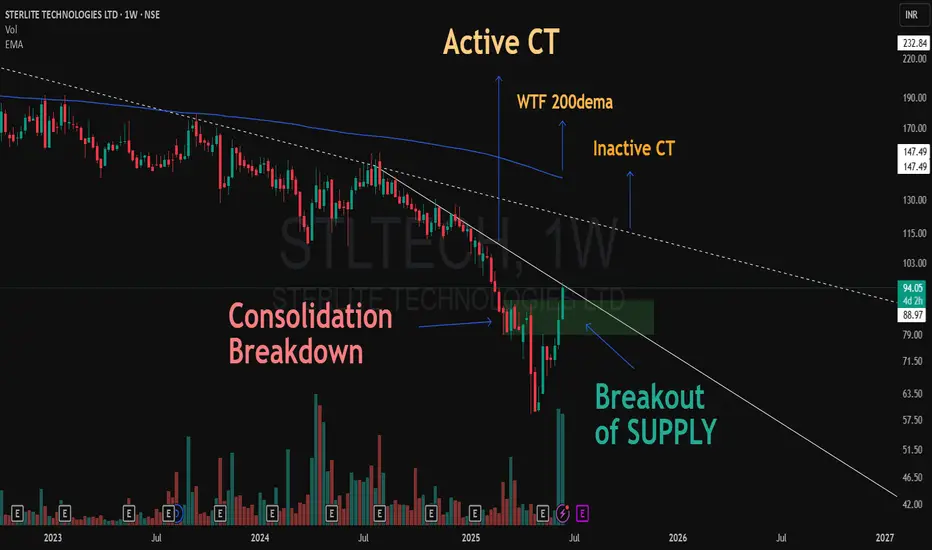
This chart of Sterlite Technologies (W1) tells a compelling price action story:
📉 The stock initially consolidated at a demand zone, only to break down sharply, flipping that zone into a fresh supply area.
💥 What followed was a strong V-shaped recovery, accompanied by significant volume expansion.
🚀 The reclaimed supply zone was decisively taken out, leading price right into the Active Counter Trendline (CT).
🔁 This Active CT now stands as a key structure; the stock needs to form a higher low near the reclaimed demand zone for structural strength.
⚠️ Ahead, we have two higher-timeframe resistances in sight:
📏 An Inactive Weekly CT (dotted)
📡 The WTF 200 DEMA, a major trend filter
While this is not a call or forecast, the shift in structure, volume, and reclaiming of supply tells a story of possible trend transition — something worth keeping on the radar.
🎯 Master My Self-Made Trading Strategy
📈 Telegram (Learn Today): t.me/hashtaghammer
✅ WhatsApp (Learn Today): wa.me/919455664601
📈 Telegram (Learn Today): t.me/hashtaghammer
✅ WhatsApp (Learn Today): wa.me/919455664601
相关出版物
免责声明
The information and publications are not meant to be, and do not constitute, financial, investment, trading, or other types of advice or recommendations supplied or endorsed by TradingView. Read more in the Terms of Use.