This chart is saying loud and clear:
We may have just printed a bottom.
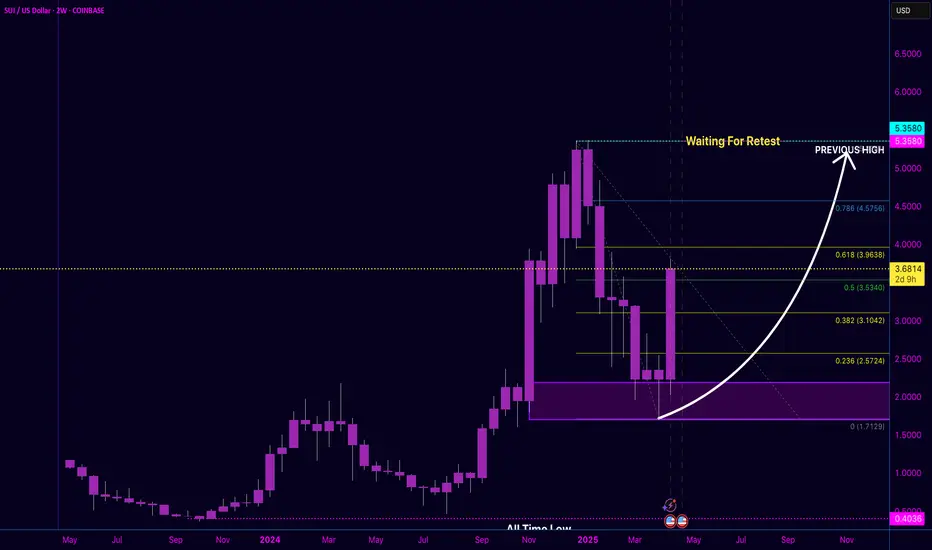
📈 After bouncing from the All-Time Low Zone, SUI surged with authority, reclaiming the .236 Fib and now eyeing .382 at $3.10+.
What I'm seeing:
✅ Bullish engulfing from demand
📊 Clear Fibonacci levels aligning with volume interest
🟣 Target area: $5.35 zone (Previous High) marked as "Waiting for Retest"
If this structure holds and momentum builds, we could see a Fibonacci wave toward the .618 at $3.96 and potentially a full retest into previous highs. But remember — confluence matters.
💡 This is why structure and candle maturity mean everything.
I’m not just reacting — I’m observing.
📍 Keep an eye on price behavior around the .382 level. That’s the next chess move.
#SUI #CryptoMarket #AltcoinSeason #ChartAnalysis #SmartMoneyFlow #FibonacciLevels #BreakoutWatch
We may have just printed a bottom.
📈 After bouncing from the All-Time Low Zone, SUI surged with authority, reclaiming the .236 Fib and now eyeing .382 at $3.10+.
What I'm seeing:
✅ Bullish engulfing from demand
📊 Clear Fibonacci levels aligning with volume interest
🟣 Target area: $5.35 zone (Previous High) marked as "Waiting for Retest"
If this structure holds and momentum builds, we could see a Fibonacci wave toward the .618 at $3.96 and potentially a full retest into previous highs. But remember — confluence matters.
💡 This is why structure and candle maturity mean everything.
I’m not just reacting — I’m observing.
📍 Keep an eye on price behavior around the .382 level. That’s the next chess move.
#SUI #CryptoMarket #AltcoinSeason #ChartAnalysis #SmartMoneyFlow #FibonacciLevels #BreakoutWatch
免责声明
这些信息和出版物并非旨在提供,也不构成TradingView提供或认可的任何形式的财务、投资、交易或其他类型的建议或推荐。请阅读使用条款了解更多信息。