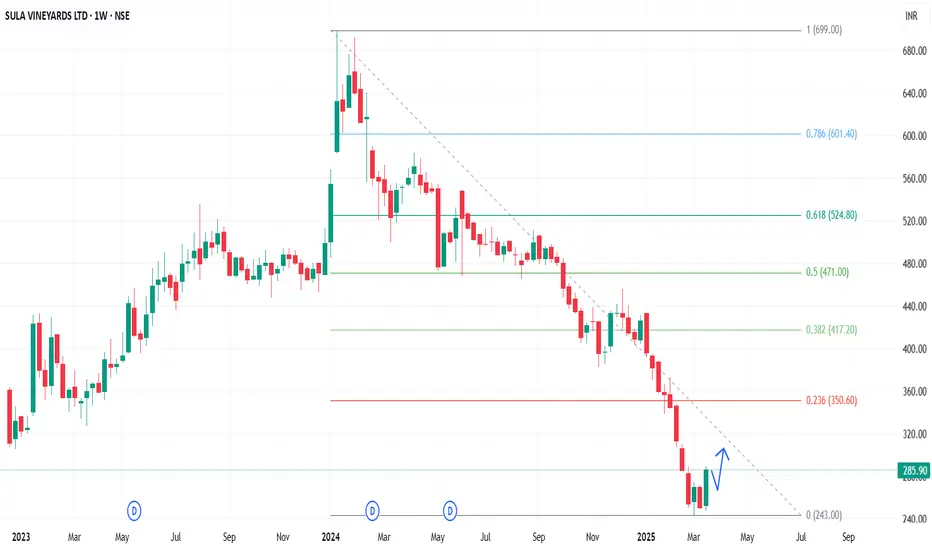
In the Weekly Chart of SULA ,
we can see that; it is showing a W shape recovery from 240-245 level.
wait for a Halt or retrace candle and then enter with SL and Targets.
Expected momentum is shared in chart.
we can see that; it is showing a W shape recovery from 240-245 level.
wait for a Halt or retrace candle and then enter with SL and Targets.
Expected momentum is shared in chart.
免责声明
这些信息和出版物并非旨在提供,也不构成TradingView提供或认可的任何形式的财务、投资、交易或其他类型的建议或推荐。请阅读使用条款了解更多信息。
免责声明
这些信息和出版物并非旨在提供,也不构成TradingView提供或认可的任何形式的财务、投资、交易或其他类型的建议或推荐。请阅读使用条款了解更多信息。