Tata Communications has completed all the phases of a classic bullish breakout, but today's trading action suggests a brief pause or indecision before a potential new leg up. The overall technical posture remains strong as long as the stock holds above its newly established support.
The Setup: An Ascending Triangle
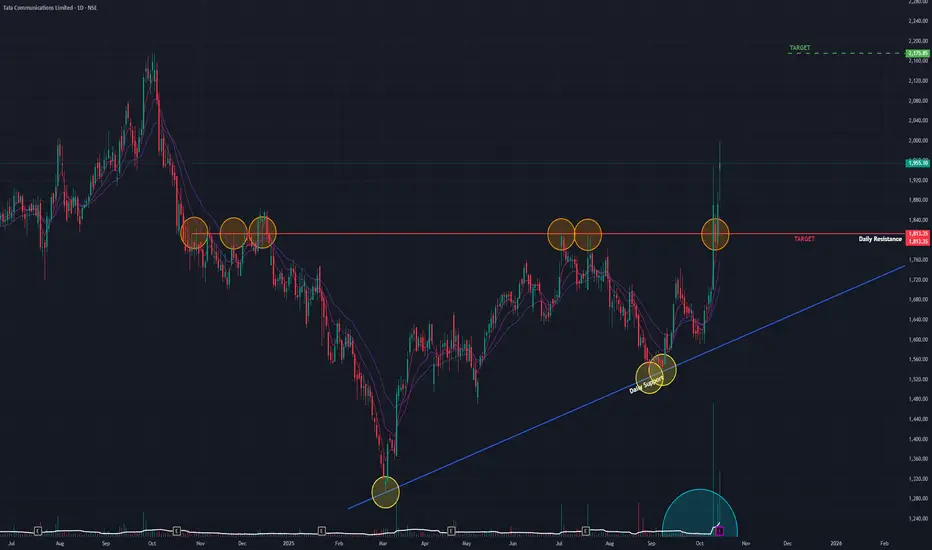
Following a brief downtrend from its September 2024 All-Time High, the stock began forming a solid base. This took the shape of a classic Ascending Triangle, characterized by a series of Higher Lows pushing up against a flat horizontal resistance of Equal Highs. This is a powerful bullish pattern that indicates building pressure.
Last week, the stock successfully broke out of this pattern. More importantly, during the current week, it performed a successful retest of the breakout level, with the old resistance now acting as new support—a strong sign of a valid breakout.
Today's Indecisive Action
Today's session (Wednesday, October 15, 2025) started with strong bullish intent:
- The stock opened with a gap-up on good volume.
- However, by the end of the day, it formed a neutral candle (like a Doji or Spinning Top).
This indicates that despite the initial buying pressure, neither bulls nor bears could gain control, resulting in a stalemate for the session. This suggests a momentary pause or indecision.
Underlying Technical Strength
Despite today's pause, the broader technical picture remains firmly bullish. Key momentum indicators, including the short-term Exponential Moving Averages (EMAs) and the Relative Strength Index (RSI), are in a bullish state across the Monthly, Weekly, and Daily timeframes.
Outlook and Key Levels
With a confirmed breakout and retest, the path of least resistance has shifted upwards.
- Bullish Target: If the bullish momentum resumes after this brief pause, the next logical area of resistance and potential target is the ₹2,175 level.
- Critical Support: The breakout point, around ₹1,813, is now the most critical support level to watch. As long as the stock remains above this "line in the sand," the bullish outlook remains intact. A close below this level would negate the breakout.
In conclusion, while today's action signals a short-term pause, the overall technical evidence is bullish. The key is for the stock to hold the critical ₹1,813 support level before continuing its uptrend.
The Setup: An Ascending Triangle
Following a brief downtrend from its September 2024 All-Time High, the stock began forming a solid base. This took the shape of a classic Ascending Triangle, characterized by a series of Higher Lows pushing up against a flat horizontal resistance of Equal Highs. This is a powerful bullish pattern that indicates building pressure.
Last week, the stock successfully broke out of this pattern. More importantly, during the current week, it performed a successful retest of the breakout level, with the old resistance now acting as new support—a strong sign of a valid breakout.
Today's Indecisive Action
Today's session (Wednesday, October 15, 2025) started with strong bullish intent:
- The stock opened with a gap-up on good volume.
- However, by the end of the day, it formed a neutral candle (like a Doji or Spinning Top).
This indicates that despite the initial buying pressure, neither bulls nor bears could gain control, resulting in a stalemate for the session. This suggests a momentary pause or indecision.
Underlying Technical Strength
Despite today's pause, the broader technical picture remains firmly bullish. Key momentum indicators, including the short-term Exponential Moving Averages (EMAs) and the Relative Strength Index (RSI), are in a bullish state across the Monthly, Weekly, and Daily timeframes.
Outlook and Key Levels
With a confirmed breakout and retest, the path of least resistance has shifted upwards.
- Bullish Target: If the bullish momentum resumes after this brief pause, the next logical area of resistance and potential target is the ₹2,175 level.
- Critical Support: The breakout point, around ₹1,813, is now the most critical support level to watch. As long as the stock remains above this "line in the sand," the bullish outlook remains intact. A close below this level would negate the breakout.
In conclusion, while today's action signals a short-term pause, the overall technical evidence is bullish. The key is for the stock to hold the critical ₹1,813 support level before continuing its uptrend.
Disclaimer: This analysis is my personal view & for educational purposes only. They shall not be construed as trade or investment advice. Before making any financial decision, it is imperative that you consult with a qualified financial professional.
免责声明
这些信息和出版物并非旨在提供,也不构成TradingView提供或认可的任何形式的财务、投资、交易或其他类型的建议或推荐。请阅读使用条款了解更多信息。