📉 1-Week Price Movement
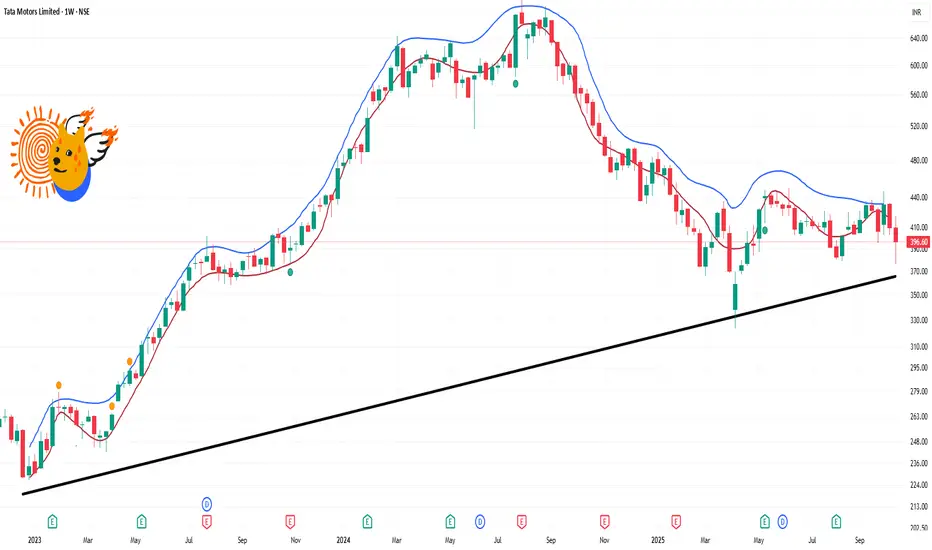
Current Price: ₹396.60
52-Week Range: ₹321.45 – ₹550.62
Recent Performance: The stock has experienced a significant decline of approximately 41.77% over the past week, largely due to the demerger of its commercial vehicle business.
📊 Technical Indicators (Weekly Overview)
Moving Averages: The stock is trading below key moving averages, indicating a bearish trend.
Relative Strength Index (RSI): The RSI is below 30, suggesting the stock is in oversold territory.
MACD: The MACD line is below the signal line, confirming a bearish momentum.
Stochastic Oscillator: The stochastic indicator is in the oversold zone, which may imply a potential reversal if buying interest returns.
相关出版物
免责声明
这些信息和出版物并非旨在提供,也不构成TradingView提供或认可的任何形式的财务、投资、交易或其他类型的建议或推荐。请阅读使用条款了解更多信息。