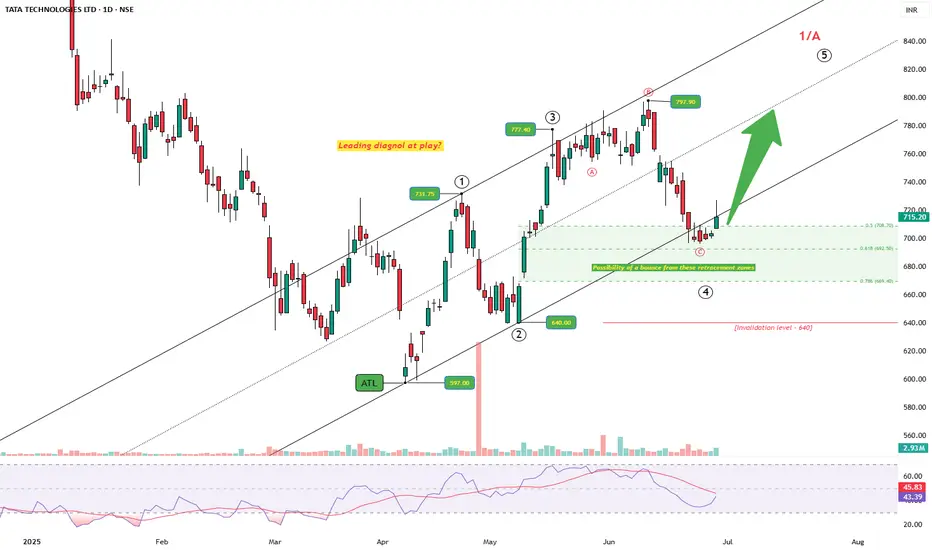
After tagging the all-time low at 597, price started a steady climb. The structure unfolding looks like a potential leading diagonal, not a typical impulsive sprint. Wave 1 pushes up to 731.75, followed by a sharp drop to 640 — a classic deep Wave 2, but still holding above the origin. From there, Wave 3 stretches to 777.4, slightly longer than Wave 1, keeping things in check.
Then comes the messy drop — choppy, overlapping, three-legged, as Wave 4 of a diagonal. It lands right into the golden retracement zone, finding support between 0.5 and 0.786.
Now the price is bouncing back and is above 715, nudging towards the upper channel. If it sustains, Wave 5 could unfold next, aiming to breach the 797 high. But — and this is crucial — if price falls below 640, this structure breaks down. That would kill the diagonal count and force a rework.
RSI is curling up from oversold, hinting at renewed strength. Price, structure, and momentum — all are beginning to align. Let's see how the price strcuture unfolds in the coming week.
WaveXplorer | Elliott Wave insights
📊 X profile: @veerappa89
📊 X profile: @veerappa89
免责声明
这些信息和出版物并非旨在提供,也不构成TradingView提供或认可的任何形式的财务、投资、交易或其他类型的建议或推荐。请阅读使用条款了解更多信息。
WaveXplorer | Elliott Wave insights
📊 X profile: @veerappa89
📊 X profile: @veerappa89
免责声明
这些信息和出版物并非旨在提供,也不构成TradingView提供或认可的任何形式的财务、投资、交易或其他类型的建议或推荐。请阅读使用条款了解更多信息。