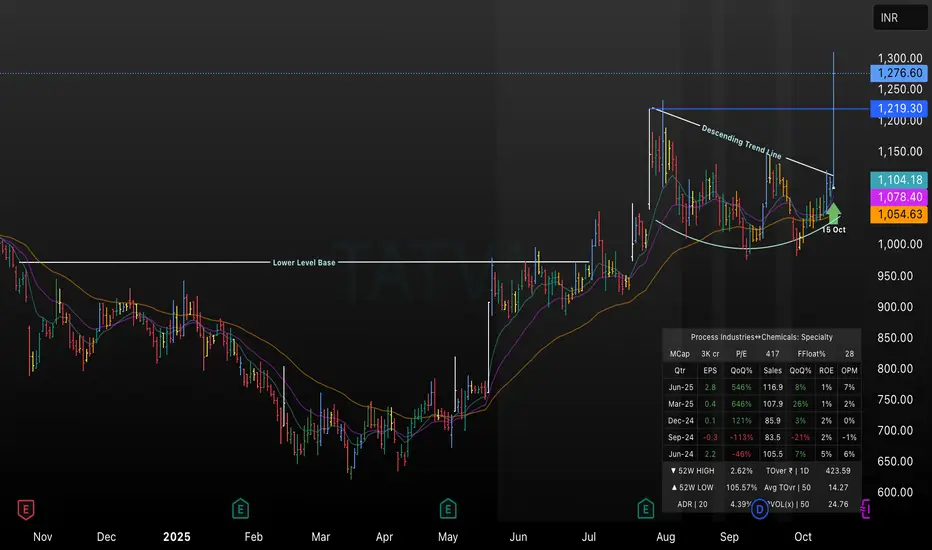
This TradingView chart highlights Tatva’s price action as it breaks above a descending trend line on October 15, 2025, signaling a strong bullish move. Key levels such as the lower base, breakout zone, and price targets (₹1219.30, ₹1276.60, ₹1300.00) are marked, with EMA indicators supporting positive momentum. The chart includes recent fundamentals, making it ideal for technical traders analyzing breakout setups and trend reversals in specialty chemicals stocks for Q4 2025
免责声明
这些信息和出版物并不意味着也不构成TradingView提供或认可的金融、投资、交易或其它类型的建议或背书。请在使用条款阅读更多信息。
免责声明
这些信息和出版物并不意味着也不构成TradingView提供或认可的金融、投资、交易或其它类型的建议或背书。请在使用条款阅读更多信息。