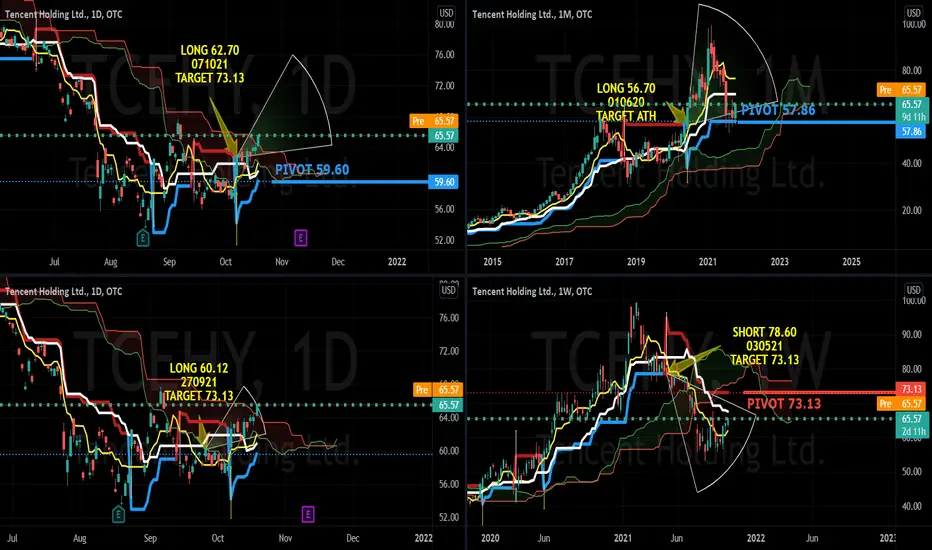
TCEHY has been on a medium term downtrend since 030521 since the short signal issued at $78.60. The long term charts is still long from 010620 at $56.70. A break above the weekly supertrend resistance at $73.13 may resume the uptrend supported by a long signal on the day charts at $62.70 on 071021
Long Term UPTREND since 010620
Medium Term DOWNTREND since 030521
Short Term BASEFORMING since 071021
PIVOT 73.13
Short positions below 73.13 for 59.60 and 41.26
Long positions above 73.13 for 99.40 and new ATH
Long Term UPTREND since 010620
Medium Term DOWNTREND since 030521
Short Term BASEFORMING since 071021
PIVOT 73.13
Short positions below 73.13 for 59.60 and 41.26
Long positions above 73.13 for 99.40 and new ATH
Quant Strategic Singapore
免责声明
这些信息和出版物并非旨在提供,也不构成TradingView提供或认可的任何形式的财务、投资、交易或其他类型的建议或推荐。请阅读使用条款了解更多信息。
Quant Strategic Singapore
免责声明
这些信息和出版物并非旨在提供,也不构成TradingView提供或认可的任何形式的财务、投资、交易或其他类型的建议或推荐。请阅读使用条款了解更多信息。