TCS - Time to go up towards 3500+ Bullish CRAB PRZ at play
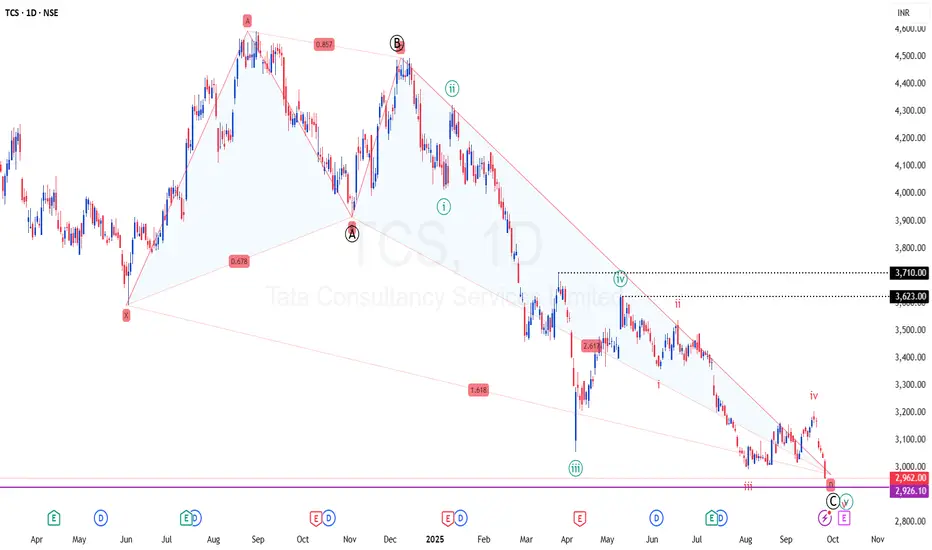
TF: Daily
CMP: 2965
Here is my previous post on this script for a detailed review.

Price has completed the potential target as per the Bullish Crab pattern.
Results are due in the next couple of weeks.
I expect the stock to bounce from this zone 2900-2950 and potentially march towards 3500+ in the coming weeks
Internal wave counts are also marked in this chart.
I will await bullish confirmation candle in this zone for a good RR entry.
Disclaimer: I am not a SEBI registered Analyst and this is not a trading advise. Views are personal and for educational purpose only. Please consult your Financial Advisor for any investment decisions. Please consider my views only to get a different perspective (FOR or AGAINST your views). Please don't trade FNO based on my views. If you like my analysis and learnt something from it, please give a BOOST. Feel free to express your thoughts and questions in the comments section.
交易开始
Got the Reversal signal on weekly TF.. Pinbar formation at the lows (2nd low) and also around the Demand/Support Zone for the week ending 3rd October..And price moved above 2930 (recent swing on shorter TF)...
注释
Now the Bullish harmonic set up and wave 3 are aligning together..注释
Price is moving well.. filled all the GAPs at the lows... Now inching higher towards filling the GAPs at the topI am not a SEBI Registered Analyst. Views are personal and for Education purpose only. Please consult your Financial Analyst before making investment decision
免责声明
这些信息和出版物并非旨在提供,也不构成TradingView提供或认可的任何形式的财务、投资、交易或其他类型的建议或推荐。请阅读使用条款了解更多信息。
I am not a SEBI Registered Analyst. Views are personal and for Education purpose only. Please consult your Financial Analyst before making investment decision
免责声明
这些信息和出版物并非旨在提供,也不构成TradingView提供或认可的任何形式的财务、投资、交易或其他类型的建议或推荐。请阅读使用条款了解更多信息。