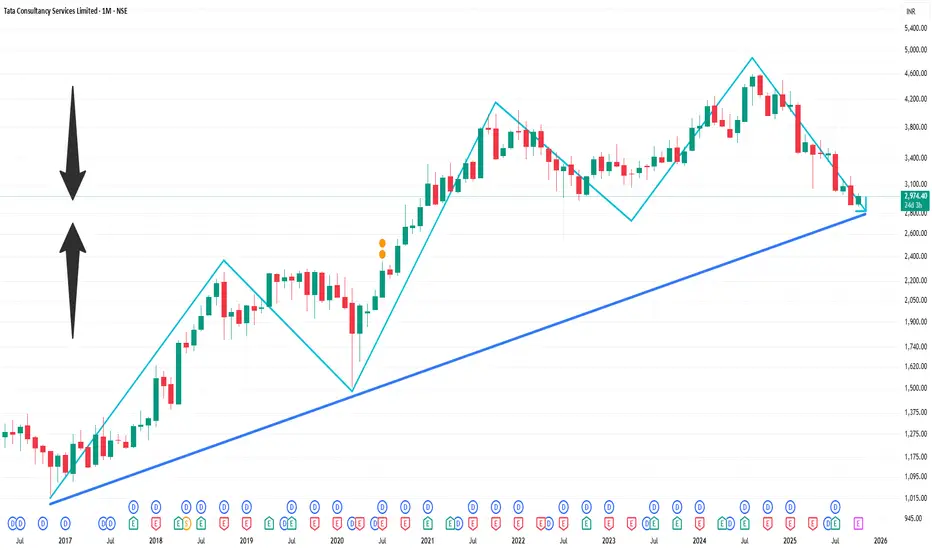
📉 Technical Overview (1-Month Timeframe)
Price Range: ₹2,867.55 – ₹3,202.95
Current Price: ₹2,962.
Trend: Bearish
According to TradingView, the 1-month technical analysis for TCS indicates a neutral outlook. However, moving averages suggest a strong sell signal. Oscillators are neutral, and pivot points are not specified.
🔍 Key Technical Indicators
Relative Strength Index (RSI): Not specified.
Moving Averages: Short-term and long-term moving averages indicate a bearish trend.
MACD: Not specified.
Pivot Points: Not specified.
🔮 Short-Term Outlook
Analysts forecast that TCS may reach ₹2,953.43 within a week and ₹2,707.65 within four weeks.
⚠️ Conclusion
The current technical indicators suggest a bearish trend for TCS over the past month. Investors should exercise caution and consider these factors when making investment decisions.
相关出版物
免责声明
这些信息和出版物并非旨在提供,也不构成TradingView提供或认可的任何形式的财务、投资、交易或其他类型的建议或推荐。请阅读使用条款了解更多信息。