🔎 Recent snapshot
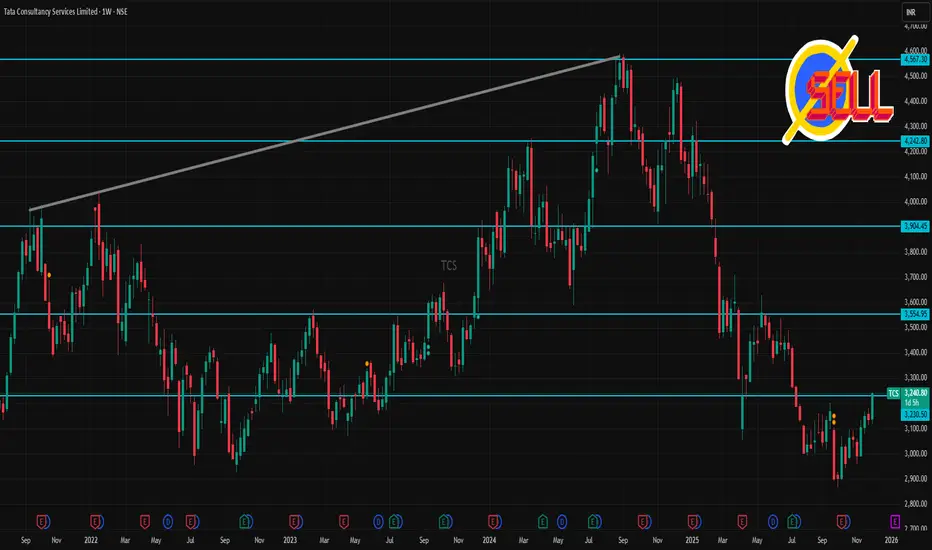
According to a recent technical‑analysis update, TCS has support near ₹2,970–₹2,870 and resistance near ₹3,170, ₹3,207, ₹3,270 on the shorter‑term charts.
On a weekly / medium‑term view, some oversold‑indicator signals have been flagged, suggesting the stock could attempt a rebound if support holds.
Analysts’ longer‑term target (12‑month) sits around ₹3,505–₹3,470, implying moderate upside from current levels.
⚠️ What could derail upside
If the stock falls below the lower support of ~₹2,870‑₹2,950, it may test deeper support zones.
Mixed signals from oscillators (some suggest bearish momentum) could limit strong short‑term rallies.
🎯 My take (for 1‑week traders)
TCS seems to be in a consolidation/neutral posture — the next few days could be defined by support‑vs‑resistance play. If you trade short‑term, the ~₹3,030–₹3,170 band defines a likely “play zone.” A decisive move beyond that could hint at short‑term trend direction.
相关出版物
免责声明
这些信息和出版物并非旨在提供,也不构成TradingView提供或认可的任何形式的财务、投资、交易或其他类型的建议或推荐。请阅读使用条款了解更多信息。