TFCILTD - Massive Cup & Handle Breakout | Daily Chart
📊 TFCILTD – Massive Cup & Handle Breakout | Fib 100% Retest | RSI Overbought | Volume Surge | Daily Chart
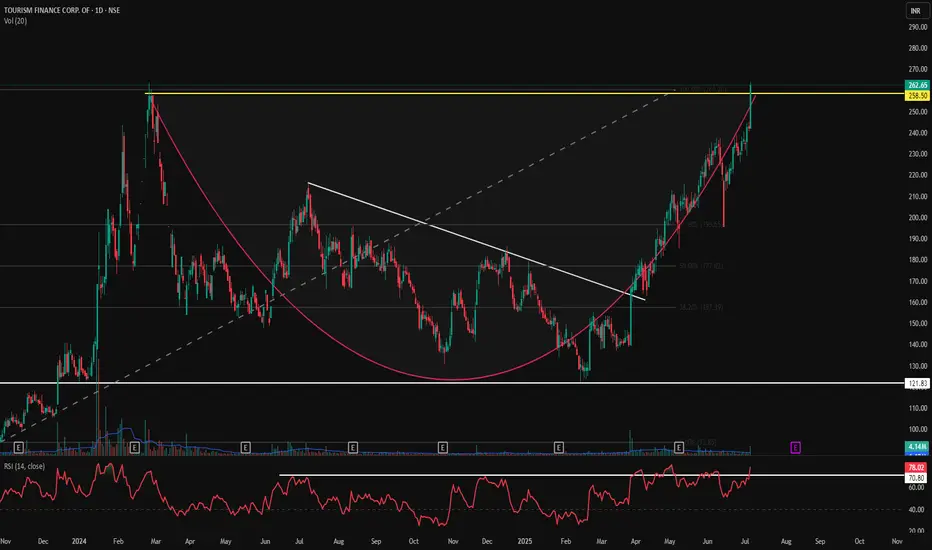
📅 Chart Date: July 6, 2025
📍 CMP: ₹262.65 (+8.48%)
📈 Symbol: NSE:TFCILTD
🔍 Technical Analysis Summary
☕ Cup & Handle Pattern Breakout
Price broke out above the Cup & Handle neckline near ₹258.50 and hit the Fibonacci 100% extension at ₹262.65.
Clean rounding bottom formation visible, followed by bullish handle and sharp breakout.
📐 Fibonacci Retracement (from swing low ₹93.85 to high ₹262.65)
50.00% – ₹177.02
61.80% – ₹196.65
✅ 100.00% – ₹262.65 (just achieved!)
📈 RSI Indicator (14)
RSI at 78.02, clearly in overbought territory – indicating momentum strength, but a minor pullback is likely.
RSI consistently above 70 for the past few sessions reflects strong trend continuation.
📊 Volume
Volume surged to 4.14M, supporting the breakout. Confirmation of pattern breakout is validated by this volume spike.
🏁 Key Technical Levels
Breakout Zone (Neckline): ₹258.50 ✅
CMP: ₹262.65
Next Resistance: Blue Sky Zone (New Highs)
Support on Retest: ₹258.50 → ₹230.67
Major Support: ₹177.02 (Fib 50%)
💡 Trade Setup Idea
Entry: On breakout confirmation above ₹258.50 or on retest
Stoploss: Below ₹230
Target: Open sky above ₹262 → Trend-following zone
Risk Level: Medium-High (due to overbought RSI)
⚠️ Disclaimer: This is an educational chart setup and not trading advice. Please conduct your own research and risk management.
📣 Follow @PriceAction_Pulse for more such clean breakouts and chart pattern analysis!
🔁 Drop a comment if TFCILTD is on your radar for the next breakout rally 📈
交易结束:到达目标
The first Sky Zone resistance level has been touched.免责声明
这些信息和出版物并不意味着也不构成TradingView提供或认可的金融、投资、交易或其它类型的建议或背书。请在使用条款阅读更多信息。
免责声明
这些信息和出版物并不意味着也不构成TradingView提供或认可的金融、投资、交易或其它类型的建议或背书。请在使用条款阅读更多信息。