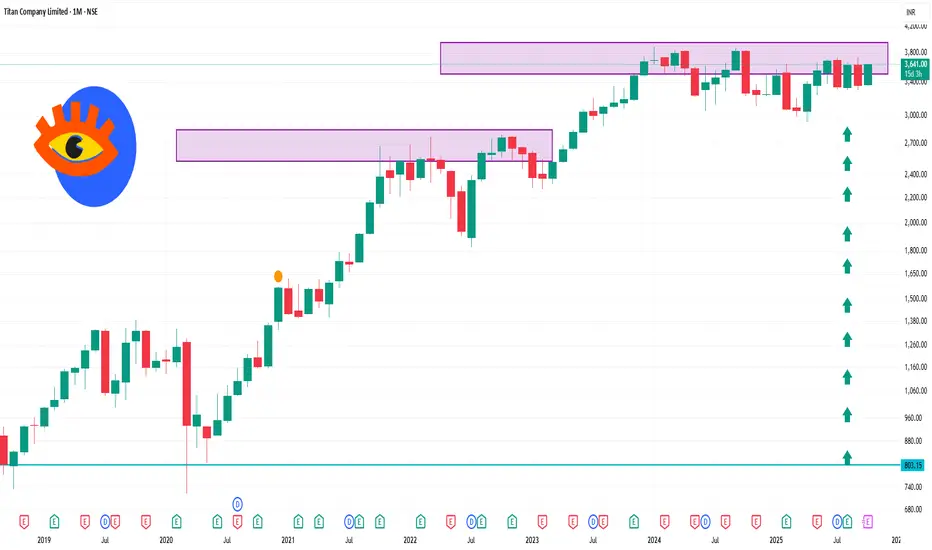
Titan Company Ltd is trading near ₹3,636.50, approaching its 52-week high of ₹3,740.
📊 1-Month Technical Overview
Price Performance: The stock has seen a modest decline of approximately 0.20% over the past month.
Technical Indicators:
Relative Strength Index (RSI): The RSI is currently in the neutral zone, indicating balanced buying and selling pressures.
Moving Averages: The stock is trading above its short-term moving averages, suggesting a positive short-term trend.
Stochastic Oscillator: The stochastic indicator is in the bullish zone, indicating potential upward momentum.
Commodity Channel Index (CCI): The CCI is above zero, signaling a bullish trend.
Rate of Change (ROC): The ROC is positive, further confirming bullish momentum.
Money Flow Index (MFI): The MFI is above 50, indicating healthy buying activity.
Support and Resistance Levels:
Support: ₹3,189.25
Resistance: ₹3,559.25
相关出版物
免责声明
这些信息和出版物并非旨在提供,也不构成TradingView提供或认可的任何形式的财务、投资、交易或其他类型的建议或推荐。请阅读使用条款了解更多信息。