🔎 Overview
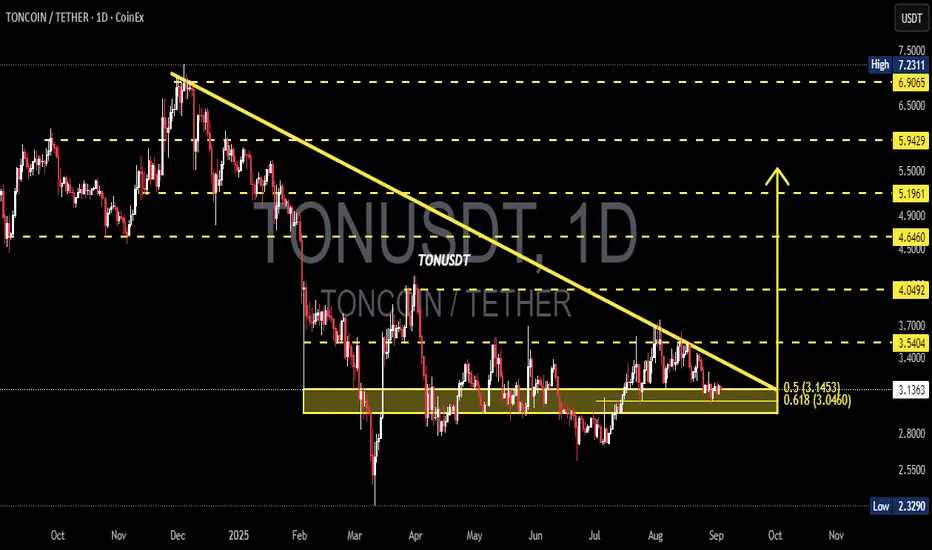
TON is currently standing at a make-or-break moment. The daily chart shows a Descending Triangle pattern, where price has been consistently pressured by a downward trendline from the early-year highs, while being strongly defended by the key support zone around 3.04 – 3.14 USDT (Fibonacci 0.5–0.618).
This setup reflects a battle between buyers accumulating at demand and sellers pressing from above. Such compression usually leads to a strong breakout or breakdown as price approaches the triangle’s apex.
---
📌 Key Technical Levels
Current Price: 3.1365 USDT
Main Support Zone:
0.618 Fib = 3.0460
0.5 Fib = 3.1453
First Resistance / breakout zone: 3.5404
Next Resistances: 4.0492 → 4.6460 → 5.1961 → 5.9429
Major Downside Support: 2.3290 (previous low)
---
🟢 Bullish Scenario (Breakout Potential)
1. Bullish confirmation occurs if price holds above 3.046 and breaks the descending trendline with a strong daily close + high volume.
2. Further validation: a close above 3.5404 will likely open the path toward 4.05 and 4.64.
3. With strong momentum, extended targets lie around 5.19 – 5.94, and eventually the major high near 7.23.
4. Narrative: A bullish breakout from a descending triangle often signals a trend reversal from accumulation.
---
🔴 Bearish Scenario (Breakdown Risk)
1. If price fails to hold above 3.0460 and closes below on the daily chart, the descending triangle confirms a bearish continuation.
2. First downside target: 2.80–2.60, with ultimate support near 2.3290.
3. If breakdown comes with strong volume, panic selling could accelerate the move lower.
4. Narrative: A bearish breakdown usually extends the prior downtrend, pushing price back to previous cycle lows.
---
📐 Pattern & Market Sentiment
Descending Triangle: A consolidation pattern within a downtrend; statistically bearish but can turn bullish if breakout volume is significant.
Volume Factor: Confirmation is critical. Breakouts without volume often lead to fake moves.
Golden Ratio Support (0.5–0.618 Fib): A historically strong support and reversal area — losing it would shift momentum back to the bears.
---
📢 Conclusion
TON stands right above its final line of defense (0.618 Fib). If this zone holds and the descending trendline is broken, bulls could ignite a move toward 3.54 – 4.05+. But if 3.046 fails, bears may drag TON back to the 2.32 lows.
In short: TON is at a “do or die” stage — expect a major breakout or breakdown soon.
---
TON/USDT is trapped inside a descending triangle with a critical support zone at Fibonacci 0.5–0.618 (3.14–3.04).
📉 Breakdown below 3.046 → risk of drop to 2.32
📈 Breakout above 3.54 → potential rally to 4.05 – 4.64
A decisive move is near — watch the volume for confirmation!
#TON #TONUSDT #Crypto #Altcoin #TradingView #TechnicalAnalysis #Fibonacci #DescendingTriangle #Breakout #SupportResistance #ChartPattern
✅ Get Free Signals! Join Our Telegram Channel Here: t.me/TheCryptoNuclear
✅ Twitter: twitter.com/crypto_nuclear
✅ Join Bybit : partner.bybit.com/b/nuclearvip
✅ Benefits : Lifetime Trading Fee Discount -50%
✅ Twitter: twitter.com/crypto_nuclear
✅ Join Bybit : partner.bybit.com/b/nuclearvip
✅ Benefits : Lifetime Trading Fee Discount -50%
免责声明
这些信息和出版物并不意味着也不构成TradingView提供或认可的金融、投资、交易或其它类型的建议或背书。请在使用条款阅读更多信息。