CRYPTO TOTAL MARKET CAP | Weekly Chart Analysis | Breakout in Progress
🔍 Let’s break down the crypto total market cap and highlight why the next move could be explosive.
⏳ Weekly Overview
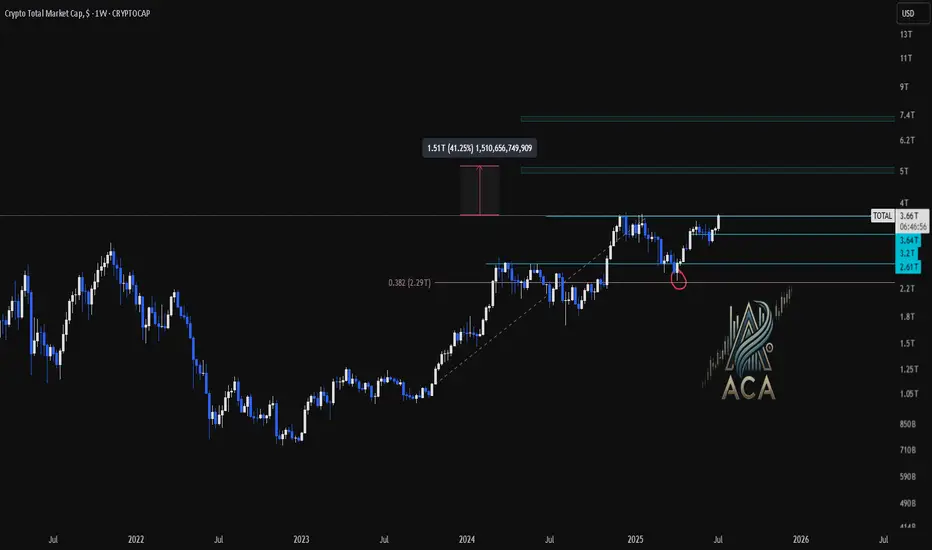
The weekly chart shows a strong breakout above the consolidation box, following a classic fakeout to the downside. The 0.382 Fibonacci retracement level at $2.29T provided solid support, confirming the bullish structure and setting the stage for this move.
🔺 Bullish Scenario:
- The market faked out below the box, trapping bears, and is now breaking out above resistance.
- The breakout targets align with the Fibonacci extension, projecting a move toward the $5T region.
- This $5T target is not only a psychological level but also matches the next major Fibonacci confluence, adding further conviction to the bullish outlook.
📊 Key Highlights:
- 0.382 Fibonacci retracement ($2.29T) held as support during the fakeout.
- Breakout above the box signals renewed momentum and a shift in market sentiment.
- Upside target around $5T is supported by both the measured move and Fibonacci extensions.
- Previous resistance levels at $3.27T and $3.54T now act as support zones.
🚨 Conclusion:
Crypto is breaking out after a textbook fakeout and reclaim of the range. With confluence from Fibonacci targets and strong momentum, the $5T region is now firmly in play as the next major target. Watch for sustained closes above $3.54T to confirm the move and open the door for further upside
🔍 Let’s break down the crypto total market cap and highlight why the next move could be explosive.
⏳ Weekly Overview
The weekly chart shows a strong breakout above the consolidation box, following a classic fakeout to the downside. The 0.382 Fibonacci retracement level at $2.29T provided solid support, confirming the bullish structure and setting the stage for this move.
🔺 Bullish Scenario:
- The market faked out below the box, trapping bears, and is now breaking out above resistance.
- The breakout targets align with the Fibonacci extension, projecting a move toward the $5T region.
- This $5T target is not only a psychological level but also matches the next major Fibonacci confluence, adding further conviction to the bullish outlook.
📊 Key Highlights:
- 0.382 Fibonacci retracement ($2.29T) held as support during the fakeout.
- Breakout above the box signals renewed momentum and a shift in market sentiment.
- Upside target around $5T is supported by both the measured move and Fibonacci extensions.
- Previous resistance levels at $3.27T and $3.54T now act as support zones.
🚨 Conclusion:
Crypto is breaking out after a textbook fakeout and reclaim of the range. With confluence from Fibonacci targets and strong momentum, the $5T region is now firmly in play as the next major target. Watch for sustained closes above $3.54T to confirm the move and open the door for further upside
免责声明
这些信息和出版物并不意味着也不构成TradingView提供或认可的金融、投资、交易或其它类型的建议或背书。请在使用条款阅读更多信息。
免责声明
这些信息和出版物并不意味着也不构成TradingView提供或认可的金融、投资、交易或其它类型的建议或背书。请在使用条款阅读更多信息。