Alts Market Cap (#ALTS) Weekly Chart Update & Analysis
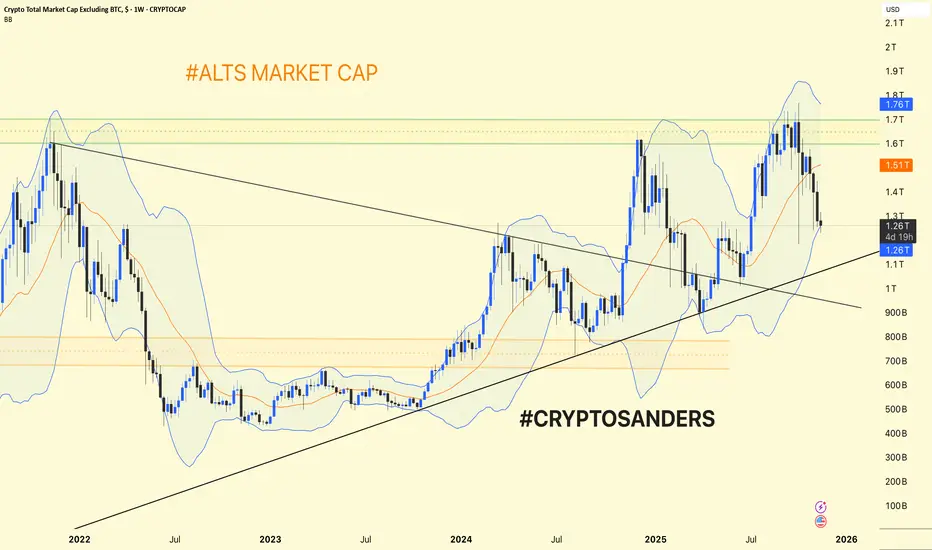
Trend Structure: The altcoin market cap (total crypto market cap excluding BTC) is trading within a broad uptrend channel after a major breakout in early 2024.
Support is currently found near $1.25T (recent swing low and channel support).
Resistance remains around $1.51T (orange line) and $1.76T (major horizontal/upper Bollinger Band zone).
Bollinger Bands: The chart uses weekly Bollinger Bands—price has pulled back from the upper band ($1.76T) and is now holding the midline ($1.26T) as short-term support.
A successful hold above $1.25T keeps the uptrend intact and sets the stage for a move back to $1.51–$1.76T.
A breakdown could lead to a deeper dip toward the long-term rising trendline (currently around $1T).
Alts are consolidating at higher lows inside an uptrend. Holding above the $1.25T area signals strength; a break above $1.51T confirms fresh upside momentum, while losing $1.25T would signal caution for further corrections.
DYOR | NFA
相关出版物
免责声明
这些信息和出版物并非旨在提供,也不构成TradingView提供或认可的任何形式的财务、投资、交易或其他类型的建议或推荐。请阅读使用条款了解更多信息。