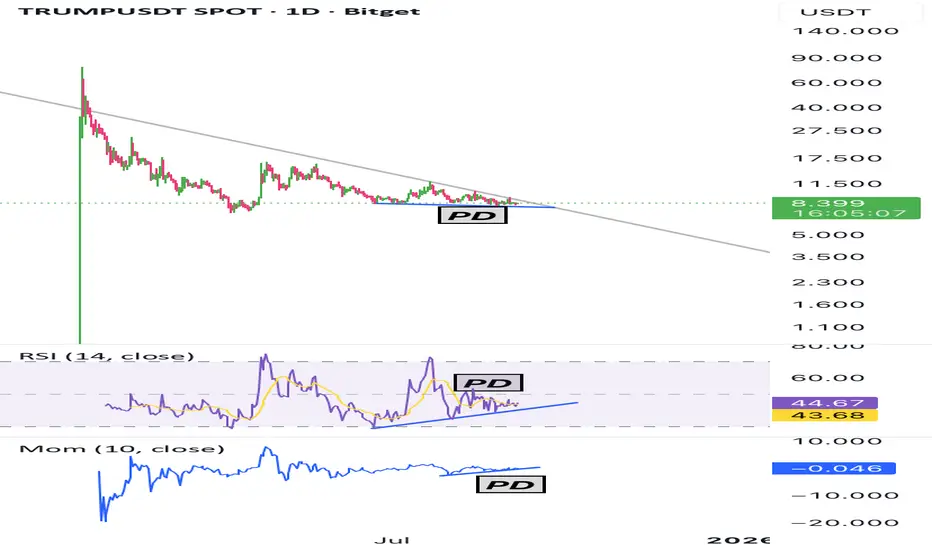
The most notable feature on the chart is the descending triangle formation where the price is consolidating while showing strong bullish divergences across multiple indicators.
🔹 Price Action:
The price keeps making lower lows but finds solid support around the 8 USDT zone, holding near the bottom of the triangle.
🔹 RSI (14):
While the price trends lower, RSI is forming higher lows. This signals weakening selling pressure and growing strength from buyers.
🔹 Momentum (Mom 10):
The Momentum indicator also prints higher lows against the lower price action. This confirms that bearish momentum is fading and increases the probability of an upside breakout.
⚡ Summary:
As the price approaches the apex of the triangle, both RSI and Momentum show strong bullish divergences. This setup may anticipate an upside breakout. A sustained move above 10 USDT could open targets around 13 – 17 – 23 USDT levels.
免责声明
这些信息和出版物并不意味着也不构成TradingView提供或认可的金融、投资、交易或其它类型的建议或背书。请在使用条款阅读更多信息。