Tesla has currently showcased two very bullish setups with one already taking place.
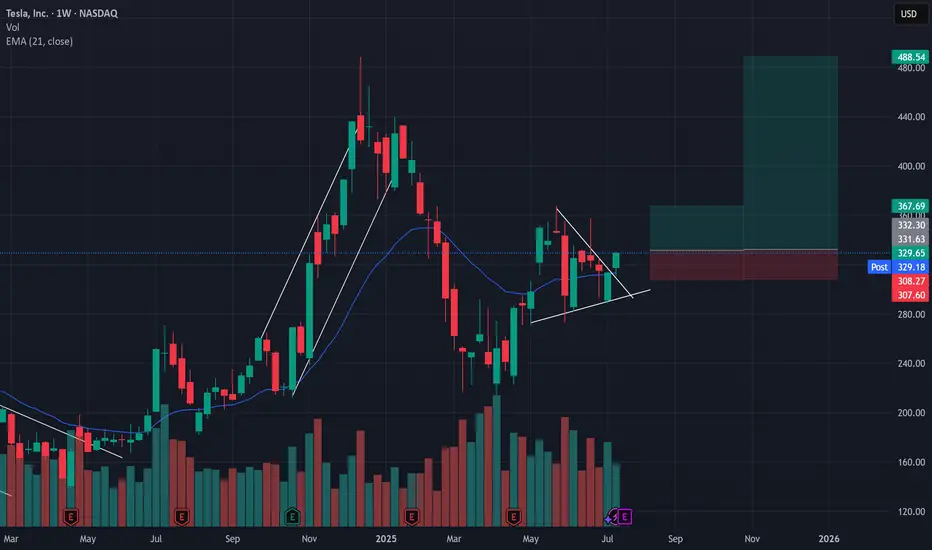
Over the past 2 month we've seen TSLA swing dramatically from a high of $368 to a low of $278 while producing lower highs and higher lows AKA a wedge formation.
Wedge formations are a low probability set up and typically produce a 50/50 breakout, however there are a couple of bullish signals on the weekly chart that have kept me in my TSLL position expecting a retest of either the $368 high and/or $490.
Bullish insights -
1 - After a strong push above the 21d EMA, TSLA had a 2 legged pull back with last week being a short failure and closing above the 21d EMA
2 - this week's candle retested the breakout trendline and closed in a very bullish candle.
3 - Tesla's $488 high was an overshoot which produced a strong breakout to the low end, however there was no new high formed meaning there is a high probability chance that we will revisit ~$500.
Trade set up Idea:
If next week's candle forms higher than this weeks bullish candle, target is $368, Stop loss is set at $306 for a 1:1.5 Risk vs reward.
Or
If next week's candle forms higher than this weeks bullish candle, target is $348, Stop loss is set at $306 for a 1:6.5 Risk vs reward.
I'm holding for the second one ;)
Current position - 7400 shares of TSLL
免责声明
这些信息和出版物并非旨在提供,也不构成TradingView提供或认可的任何形式的财务、投资、交易或其他类型的建议或推荐。请阅读使用条款了解更多信息。
免责声明
这些信息和出版物并非旨在提供,也不构成TradingView提供或认可的任何形式的财务、投资、交易或其他类型的建议或推荐。请阅读使用条款了解更多信息。