Prediction:
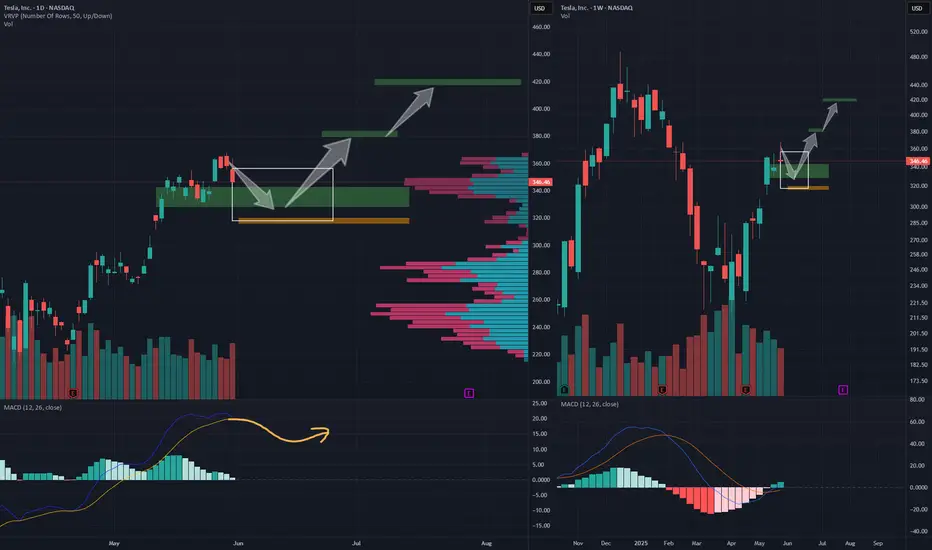
TSLA will likely pull back to the green range (328–342), and in extreme cases, it may dip to the 318–320 area before starting a rally toward ~380 in June or July.
Eventually, it may aim for the ~420 range as the full target, though I’m not very confident about that at this point.
On the daily chart, the overall setup is forming a bull flag pattern, with the MACD showing a potential pullback reversal in the high-range.
The gap between 307 and 311 likely won’t be filled in the near future.
Action:
I plan to accumulate long positions around ~335 and will add more if it drops to 320, or if it breaks above the 10 SMA after breaking below the 20 MA without hitting 320.
Stop loss will be at filling the gap or breaking down 60 SMA.
Potential-loss ratio is 2:1 to 3:1, which is not ideal for TSLA or TSLL. So I will be looking for calls or BCS.
交易结束:到达止损
The gap was filled, and the drama began. This idea has stopped, and I will be looking for another opportunity.免责声明
这些信息和出版物并非旨在提供,也不构成TradingView提供或认可的任何形式的财务、投资、交易或其他类型的建议或推荐。请阅读使用条款了解更多信息。
免责声明
这些信息和出版物并非旨在提供,也不构成TradingView提供或认可的任何形式的财务、投资、交易或其他类型的建议或推荐。请阅读使用条款了解更多信息。