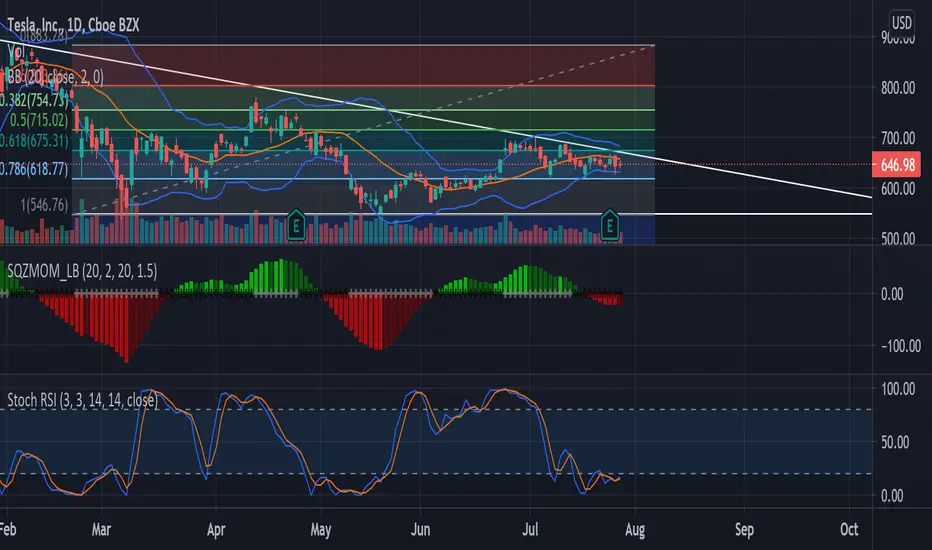
As you can see TSLA is forming a descending triangle which normally suggest bearishness, but both the daily and weekly suggest a squeeze to the upside. If Stoch Oscillator rose upward as we got closer to the breakout resistance than that would help indicate bullishness. I will list price targets below. I recommend watching this stock till an oversold oscillator starts to gradually increase to provide greater confirmation to a breakout.
Bullish Signals
-Squeeze Indicator
Price Targets
-672, 714, 752, 806, 886
Support
-622
Bullish Signals
-Squeeze Indicator
Price Targets
-672, 714, 752, 806, 886
Support
-622
免责声明
这些信息和出版物并不意味着也不构成TradingView提供或认可的金融、投资、交易或其它类型的建议或背书。请在使用条款阅读更多信息。