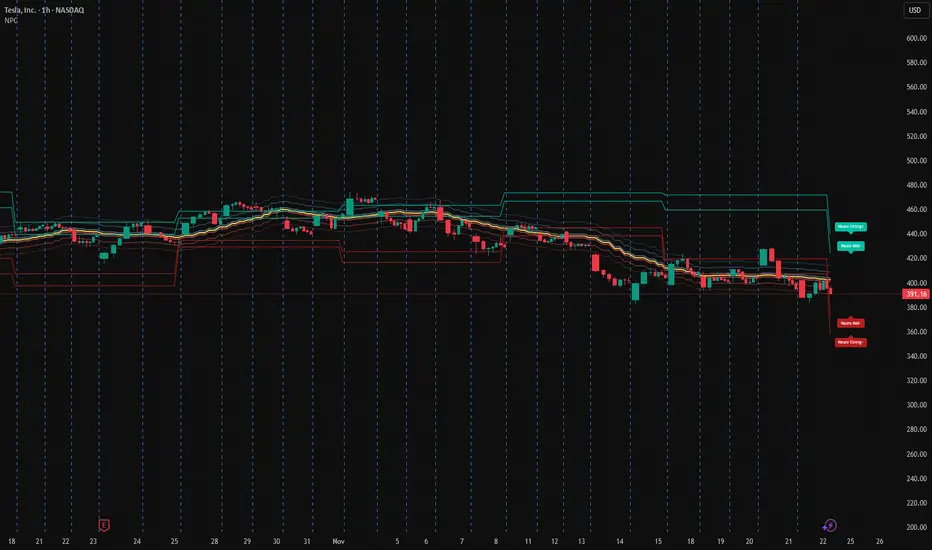
Tesla is currently trading inside a NPC post-distribution compression range after breaking down from the upper volatility structure.
Instead of predicting direction, here’s the statistical positioning based on the NeuroPolynomial Channel:
Current Positioning:
• Price under NPC Core Cluster
• Distance to lower stress band: ~1.4%
• Distance to upper expansion band: ~3.2%
• Compression vs prior impulse: ~0.61
NPC Volatility Map:
• Upper Expansion Zone: +3% to +3.8%
• Core Equilibrium: 400–412 zone
• Lower Rejection Band: −1.4%
• Breakdown Continuation Zone: −2.8% to −3.5%
Interpretation (scenario-based):
– Sustained acceptance above core → structural rebuild attempt
– Rejection at core → continuation inside stress band
– Re-entry into strong-lower → extension zone unlock
This is a volatility structure map, not a prediction model.
AI-driven market structure analysis.
免责声明
这些信息和出版物并非旨在提供,也不构成TradingView提供或认可的任何形式的财务、投资、交易或其他类型的建议或推荐。请阅读使用条款了解更多信息。
AI-driven market structure analysis.
免责声明
这些信息和出版物并非旨在提供,也不构成TradingView提供或认可的任何形式的财务、投资、交易或其他类型的建议或推荐。请阅读使用条款了解更多信息。