Hello friends, I haven't shared an analysis for a long time. I'm back in the market. Don't forget to follow me for my regular analysis.
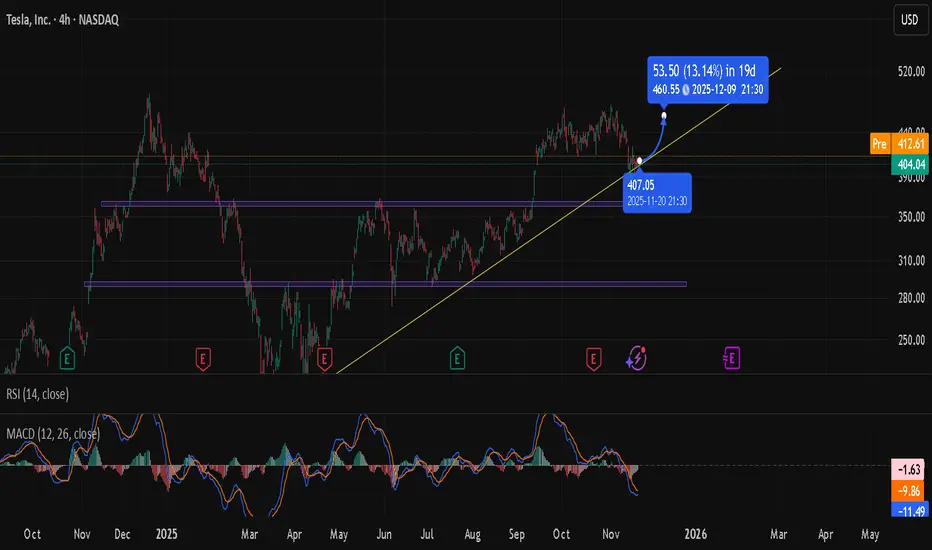
The chart shows that Tesla continues to hold its medium-term upward trend. The price recently tested the 408–410 support zone, which aligns with the rising trend line, and has reacted from that level. This area is technically significant, as it coincides with both trend support and a region where short-term liquidity has accumulated.
On the upside, the first notable resistance appears around 462–465. The projected ~13% potential move on the chart also points toward this region, suggesting that a rebound toward this level is plausible as long as the trend support remains intact.
Looking at the indicators:
RSI is currently within the 41–48 range, not in oversold territory but reflecting weakened momentum. This supports the idea that price is stabilising near a meaningful support area.
MACD remains in negative territory, indicating that bullish momentum has not fully recovered yet. A clearer shift toward the zero line would help confirm any sustained upward move.
In summary:
* The 408–410 zone is acting as a solid support.
* The broader trend structure remains intact and upward.
* 462–465 is the first major target area.
* However, momentum indicators are still soft, so confirmation through stronger candles would be constructive.
Volatility may remain elevated in the short term, but as long as the price stays above trend support, upward attempts appear more likely.
Disclaimer: This is a technical assessment only and does not constitute investment advice.*
免责声明
The information and publications are not meant to be, and do not constitute, financial, investment, trading, or other types of advice or recommendations supplied or endorsed by TradingView. Read more in the Terms of Use.
免责声明
The information and publications are not meant to be, and do not constitute, financial, investment, trading, or other types of advice or recommendations supplied or endorsed by TradingView. Read more in the Terms of Use.