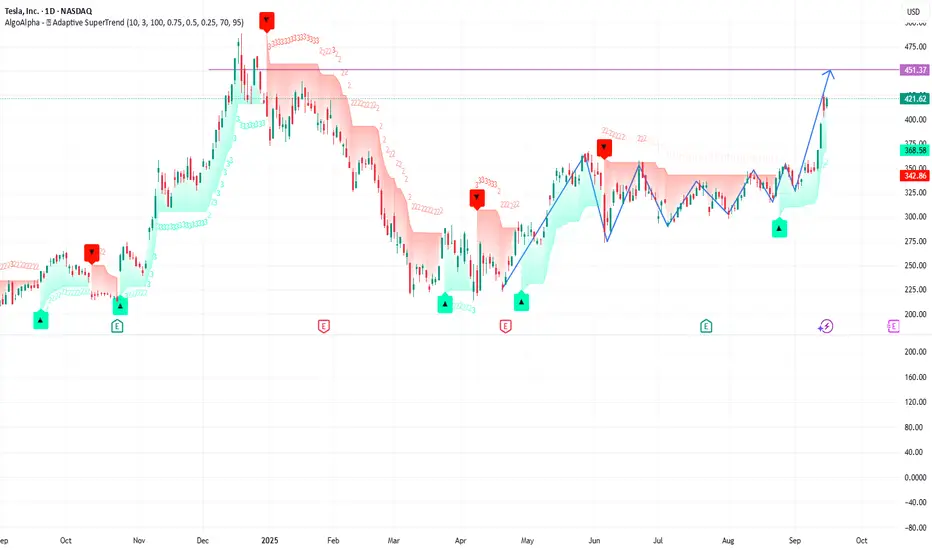
I think TSLA is moving up
The 1D timeframe show us how it was on a range and a few days ago started to go up
Next lvl should be 450, but also can go to 480
What do you think?
Bullish or bearish?
Do you see the bull flag?
Also the size and shape of candles remember me to a bullish movement.
When you see candlesticks all the day, everyday, you can see a pattern!
Lol
免责声明
这些信息和出版物并非旨在提供,也不构成TradingView提供或认可的任何形式的财务、投资、交易或其他类型的建议或推荐。请阅读使用条款了解更多信息。
免责声明
这些信息和出版物并非旨在提供,也不构成TradingView提供或认可的任何形式的财务、投资、交易或其他类型的建议或推荐。请阅读使用条款了解更多信息。