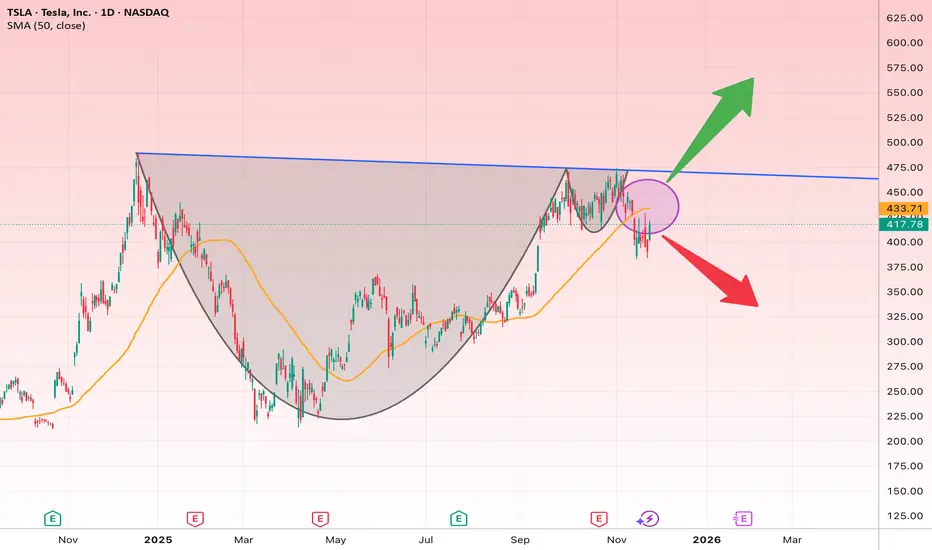
The chart shows a clear Cup & Handle pattern forming on the daily timeframe. Price touched the descending resistance (blue line) and failed to break out, placing TSLA at a critical decision point.
Key Points:
• Main Resistance: 450–465 zone (descending trendline + neckline of pattern)
• Major Support: 395–400 zone
• The 50-day MA is currently acting as near-term resistance.
Bullish Scenario (If price breaks above 465)
A breakout with a daily close above 465 would likely trigger:
• Target 1: $500
• Target 2: $545
• Target 3: $600
Bearish Scenario (If 395 breaks)
A breakdown below 395 may lead to:
• Bearish Target 1: $360
• Target 2: $325
Suggested Stop-Loss:
• $394 (for long positions)
免责声明
这些信息和出版物并非旨在提供,也不构成TradingView提供或认可的任何形式的财务、投资、交易或其他类型的建议或推荐。请阅读使用条款了解更多信息。
免责声明
这些信息和出版物并非旨在提供,也不构成TradingView提供或认可的任何形式的财务、投资、交易或其他类型的建议或推荐。请阅读使用条款了解更多信息。