🚗 TSLA Technical Outlook – Symmetrical Triangle Breakout Watch
Ticker: TSLA (Tesla, Inc.)
Timeframe: 30-minute candles
🔍 Current Setup
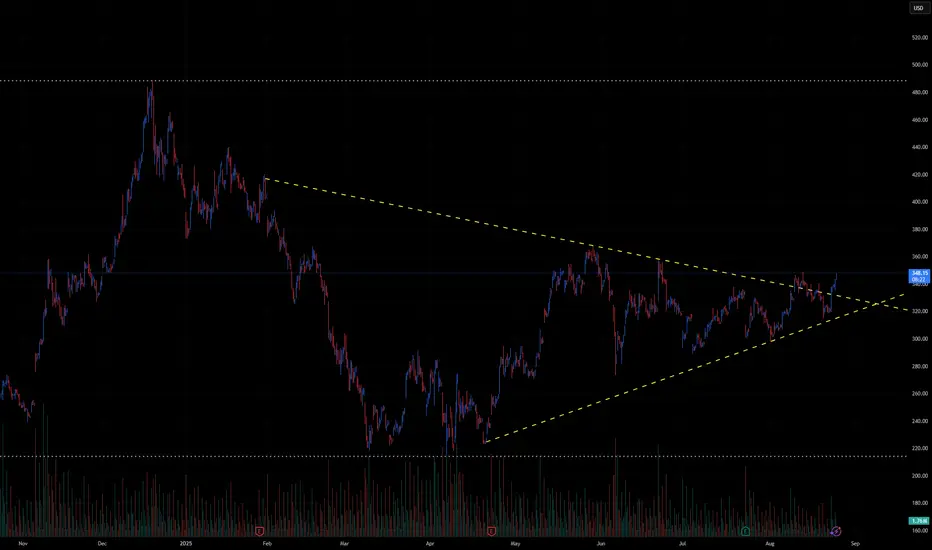
TSLA has been consolidating for months inside a large symmetrical triangle, marked by:
Descending resistance: from ~380 down to ~347.
Ascending support: from April lows near ~240, now rising toward ~320.
Current price: ~348, testing the upper boundary of the triangle.
This structure signals compression after a major downtrend, and the breakout direction will likely define TSLA’s next big move.
📊 Breakout Levels
🚀 Upside (Bullish Scenario)
Trigger: Break and close above 350–355.
Intermediate Targets:
370–380 → First resistance zone.
400–420 → Extension levels.
Measured Move Target: ~450+ (based on the triangle height projection).
🔻 Downside (Bearish Scenario)
Trigger: Failure at resistance and break below 320, confirmation under 310.
Intermediate Supports:
300 → Psychological level.
280–260 → Stronger support zone.
Measured Move Target: ~250 (triangle projection downward).
📈 Volume Analysis
Volume has been contracting steadily during the triangle’s formation.
A major volume spike will be key to confirming whichever direction TSLA chooses.
⚖️ Probability Bias
TSLA is at the make-or-break resistance zone (~350).
A breakout above 355 would strongly favor bulls, targeting 380 → 400+.
But a rejection here and break below 320 would shift momentum bearish, sending TSLA back toward 280–260.
✅ Takeaway
TSLA is at a critical inflection point inside a long-term triangle:
Bullish Break > 355: Targets 370 → 400 → 450+
Bearish Break < 320: Targets 300 → 280 → 250
Watch for volume-backed confirmation, as this move could define Tesla’s next multi-week trend.
Ticker: TSLA (Tesla, Inc.)
Timeframe: 30-minute candles
🔍 Current Setup
TSLA has been consolidating for months inside a large symmetrical triangle, marked by:
Descending resistance: from ~380 down to ~347.
Ascending support: from April lows near ~240, now rising toward ~320.
Current price: ~348, testing the upper boundary of the triangle.
This structure signals compression after a major downtrend, and the breakout direction will likely define TSLA’s next big move.
📊 Breakout Levels
🚀 Upside (Bullish Scenario)
Trigger: Break and close above 350–355.
Intermediate Targets:
370–380 → First resistance zone.
400–420 → Extension levels.
Measured Move Target: ~450+ (based on the triangle height projection).
🔻 Downside (Bearish Scenario)
Trigger: Failure at resistance and break below 320, confirmation under 310.
Intermediate Supports:
300 → Psychological level.
280–260 → Stronger support zone.
Measured Move Target: ~250 (triangle projection downward).
📈 Volume Analysis
Volume has been contracting steadily during the triangle’s formation.
A major volume spike will be key to confirming whichever direction TSLA chooses.
⚖️ Probability Bias
TSLA is at the make-or-break resistance zone (~350).
A breakout above 355 would strongly favor bulls, targeting 380 → 400+.
But a rejection here and break below 320 would shift momentum bearish, sending TSLA back toward 280–260.
✅ Takeaway
TSLA is at a critical inflection point inside a long-term triangle:
Bullish Break > 355: Targets 370 → 400 → 450+
Bearish Break < 320: Targets 300 → 280 → 250
Watch for volume-backed confirmation, as this move could define Tesla’s next multi-week trend.
交易开始
MASSIVE WIN OVER $420 TODAY免责声明
这些信息和出版物并不意味着也不构成TradingView提供或认可的金融、投资、交易或其它类型的建议或背书。请在使用条款阅读更多信息。
免责声明
这些信息和出版物并不意味着也不构成TradingView提供或认可的金融、投资、交易或其它类型的建议或背书。请在使用条款阅读更多信息。