TSM Weekly Chart Analysis – Momentum Shift in Play
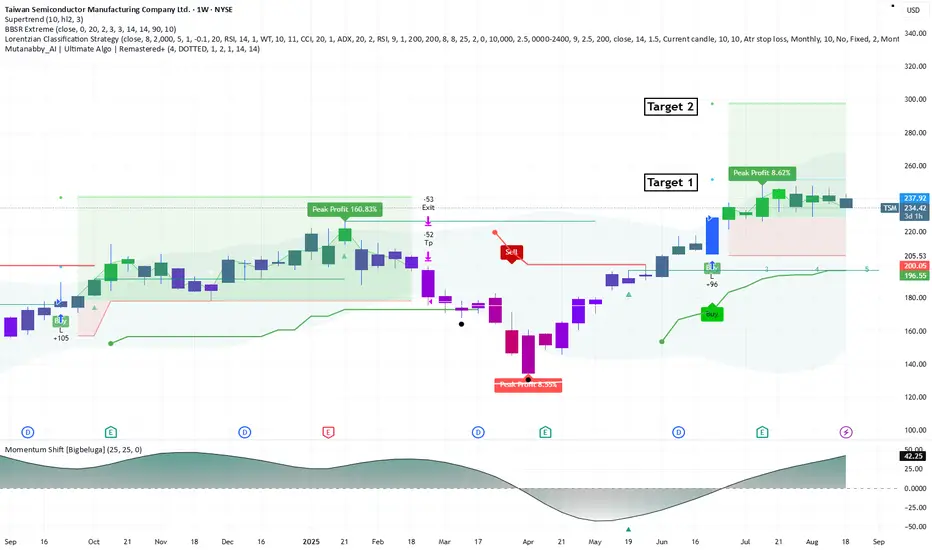
Taiwan Semiconductor (TSM) is showing signs of a major momentum shift on the weekly chart. Using a combination of MutantBuy.AI, Ultimate Algo, and BBR Extreme Close, we’ve identified key zones of support and resistance, along with potential buy/sell signals and profit targets.
Key Highlights:
Momentum Shift detected via [bigalgo] – signaling a possible trend reversal.
Uncertain Classification Std. suggests volatility ahead – ideal for strategic entries.
Support and Resistance zones mapped across 1D and 2W timeframes.
Algorithmic signals from MutantBuy.AI point to bullish potential.
Trade Setup:
Target 1: 272.00
Target 2: 300.00
Stop Loss: 198.95
Follow me for more AI-powered insights and weekly chart breakdowns.
Like and follow if you want to stay ahead of the curve with smart trading strategies.
免责声明
这些信息和出版物并非旨在提供,也不构成TradingView提供或认可的任何形式的财务、投资、交易或其他类型的建议或推荐。请阅读使用条款了解更多信息。
免责声明
这些信息和出版物并非旨在提供,也不构成TradingView提供或认可的任何形式的财务、投资、交易或其他类型的建议或推荐。请阅读使用条款了解更多信息。