TTEC (NASDAQ)
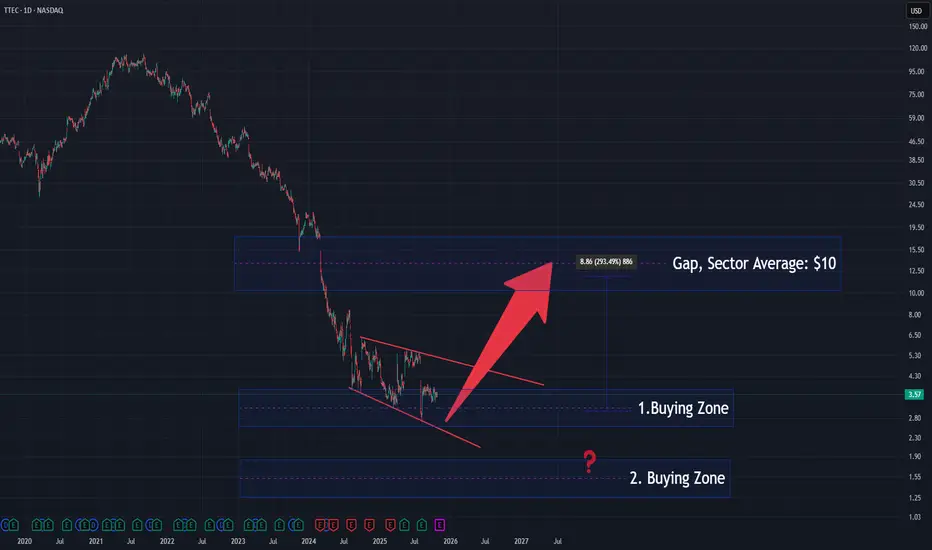
The price structure is forming a descending diagonal, suggesting a potential exhaustion phase of the ongoing downtrend.
The stock is currently trading inside the 1st Buying Zone, with a possible deeper test toward the 2nd Buying Zone before a sustained reversal begins.
The sector average stands near $10, aligning with the gap area, which could act as a major upside target if accumulation continues.
📈 A confirmed breakout from the diagonal pattern would strengthen the bullish bias toward that sector-level equilibrium.
💼 Professional market insights & charts:
cakirinsights.com/
cakirinsights.com/
免责声明
这些信息和出版物并不意味着也不构成TradingView提供或认可的金融、投资、交易或其它类型的建议或背书。请在使用条款阅读更多信息。
💼 Professional market insights & charts:
cakirinsights.com/
cakirinsights.com/
免责声明
这些信息和出版物并不意味着也不构成TradingView提供或认可的金融、投资、交易或其它类型的建议或背书。请在使用条款阅读更多信息。