Price Action & Trend
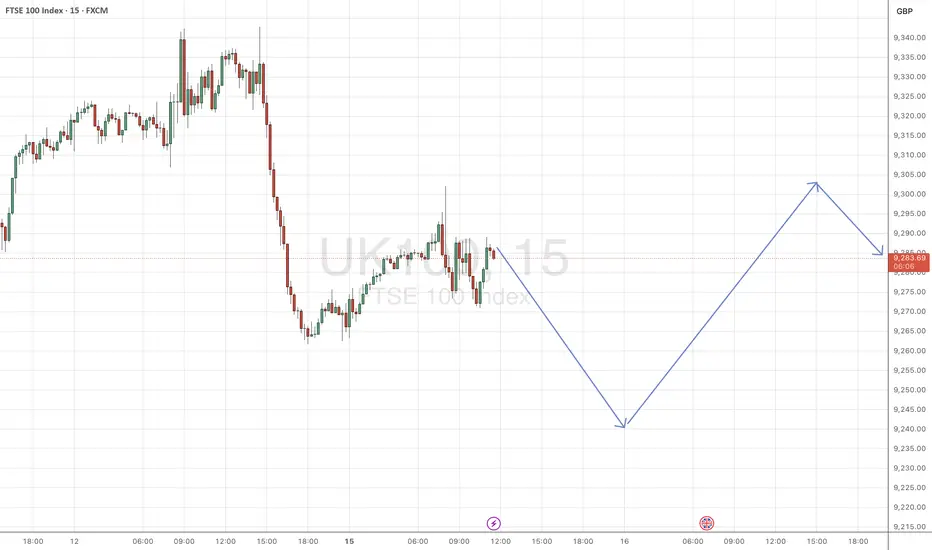
The FTSE is currently at 9,281.7, just below the daily pivot (9,289).
Price is trading within a rising trend channel (red lines).
Higher lows since early September suggest short-term bullish momentum.
Moving Averages (EMA 10, 25, 200)
EMA (10) and EMA (25) are pointing upward, supporting short-term bullishness.
Price is above the EMA (200), confirming the longer-term uptrend is intact.
Pivot Points (Support/Resistance)
Pivot (P): 9,289 → price is hovering around here.
R1: 9,318, R2: 9,369, R3: 9,398 → upside resistance levels.
S1: 9,256, S2: 9,218, S3: 9,158 → downside support levels.
RSI (10)
RSI at ~58.4 → neutral to bullish, not yet overbought.
Trading Ideas
📈 Bullish Setup (trend-following)
Buy near support: ideally around S1 (9,256) or EMA (25).
Target: R1 (9,318), then R2 (9,369).
Stop-loss: below S2 (9,218).
📉 Bearish Setup (counter-trend / pullback)
Short near resistance: R1 (9,318) or upper channel line.
Target: back to Pivot (9,289) or S1 (9,256).
Stop-loss: above R2 (9,369).
⚠️ Neutral / Range Play
Since price is consolidating around the daily pivot, intraday traders might scalp between S1 (9,256) and R1 (9,318) until a breakout occurs.
免责声明
这些信息和出版物并不意味着也不构成TradingView提供或认可的金融、投资、交易或其它类型的建议或背书。请在使用条款阅读更多信息。
免责声明
这些信息和出版物并不意味着也不构成TradingView提供或认可的金融、投资、交易或其它类型的建议或背书。请在使用条款阅读更多信息。