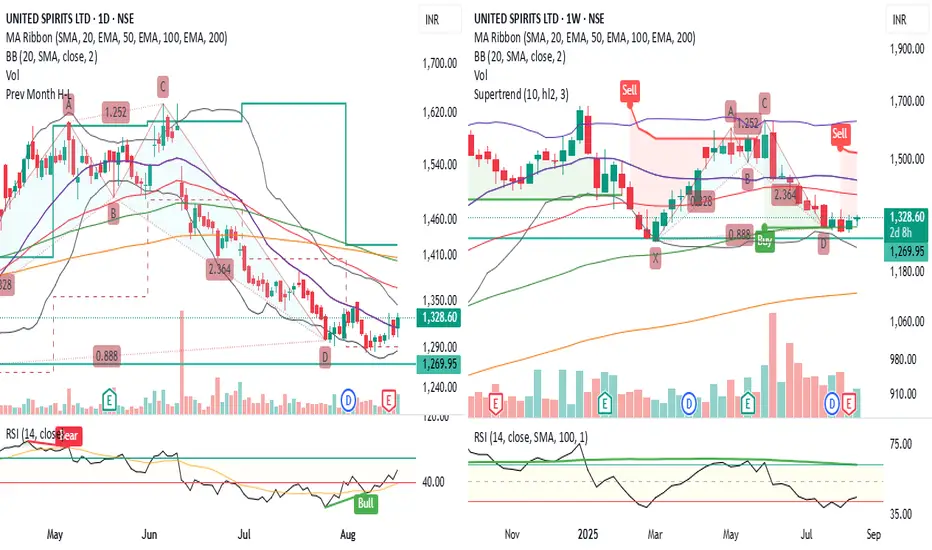
UNITED SPIRITS is an interesting chart
It is forming Bullish Shark like pattern on daily / weekly charts
Price Crossed above 20 SMA on daily chart
Price Took Support at 100 EMA on weekly chart near 1300 levels
Multiple hammer like candles and dojis formed on Daily chart in last few days
Double bottoms formed with Positive RSI Divergences.
Lets See how it evolves from here further
Disclaimer: NOT A BUY / SELL RECOMMENDATION I am not an expert I just share interesting charts here for educational purpose and not to be taken as buy/sell recommendation. Please seek expert opinion before investing and trading as trading/ investing in market is subject to market risks. I do not hold any position in the stock as on date but I may look to take some position with my own Risk Reward matrix.
免责声明
这些信息和出版物并不意味着也不构成TradingView提供或认可的金融、投资、交易或其它类型的建议或背书。请在使用条款阅读更多信息。
免责声明
这些信息和出版物并不意味着也不构成TradingView提供或认可的金融、投资、交易或其它类型的建议或背书。请在使用条款阅读更多信息。