Hello traders 🐺 .
in this idea I want to look at the UNI because in the last couples of weeks this coin wasn't very interesting and UNI price tested downtrend ; so when I saw the UNI chart found interesting chart and think maybe it's time for UNI to revers the trend .

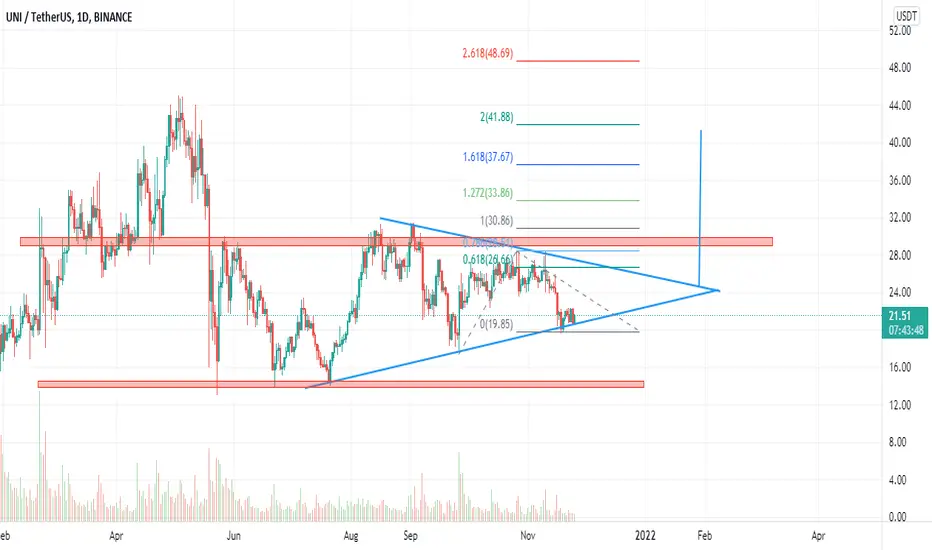
as you can see in the picture above , if I draw the Fibonacci retracement from the previous low up to the top , we can see UNI price found support at 0.786 Fibonacci retracement level which is the primary sign of the creation of the W pattern ; so if UNI price hold this level and doesn't create lower low we can say there is good chance for UNI price to have trend reversal .
So if I imagine current price level as a higher low and say this is the end of the current down trend , I can calculate the next price targets for this 2 pattern ; first W pattern and second one is the symmetrical triangle which is more longer term than first pattern .
W pattern :

the interesting fact about this pattern is that this pattern have very close important points with the symmetrical triangle , for example the second low of the W pattern is exactly above the symmetrical triangle trend line , and also for reaching the W pattern price target , UNI price must break out from the triangle pattern .
but let's talk about the W pattern price target then I talk about the symmetrical triangle price targets :
as you can see in the chart , it make sense to say the first target of this pattern is downward slopping trend line of the symmetrical triangle , because there is strong resistance at that price level and also that is in alignment with the 0.618 Fibonacci level .
but if price succeed to break the triangle trend line the next target could be around weekly resistance structure (red resistance box) ; but usually I think the best place to take profit is at 1.27 and 1.618 and in this case if price reach those price targets there is strong chance to see some correction and maybe retesting the weekly structure .
symmetrical triangle :

the technical target of the symmetrical triangle calculate like the above picture ; and you can see the technical target of the triangle is very close to 2.0 Fibonacci level and also the all time high , so make sure to take some profit at that level .
let's look at the 4H chart :

in the 4H chart you can see price create W pattern and also the W pattern neck line is in alignment with the 4H resistance structure (yellow box)
if UNI succeed to break the neck line the next price target could be around 24.5$ at the next 4H structure .
🐺I hope you enjoyed this analysis.
Do not forget to like and subscribe
share my ideas with your friends , thanks for reading my idea🐺
in this idea I want to look at the UNI because in the last couples of weeks this coin wasn't very interesting and UNI price tested downtrend ; so when I saw the UNI chart found interesting chart and think maybe it's time for UNI to revers the trend .
as you can see in the picture above , if I draw the Fibonacci retracement from the previous low up to the top , we can see UNI price found support at 0.786 Fibonacci retracement level which is the primary sign of the creation of the W pattern ; so if UNI price hold this level and doesn't create lower low we can say there is good chance for UNI price to have trend reversal .
So if I imagine current price level as a higher low and say this is the end of the current down trend , I can calculate the next price targets for this 2 pattern ; first W pattern and second one is the symmetrical triangle which is more longer term than first pattern .
W pattern :
the interesting fact about this pattern is that this pattern have very close important points with the symmetrical triangle , for example the second low of the W pattern is exactly above the symmetrical triangle trend line , and also for reaching the W pattern price target , UNI price must break out from the triangle pattern .
but let's talk about the W pattern price target then I talk about the symmetrical triangle price targets :
as you can see in the chart , it make sense to say the first target of this pattern is downward slopping trend line of the symmetrical triangle , because there is strong resistance at that price level and also that is in alignment with the 0.618 Fibonacci level .
but if price succeed to break the triangle trend line the next target could be around weekly resistance structure (red resistance box) ; but usually I think the best place to take profit is at 1.27 and 1.618 and in this case if price reach those price targets there is strong chance to see some correction and maybe retesting the weekly structure .
symmetrical triangle :
the technical target of the symmetrical triangle calculate like the above picture ; and you can see the technical target of the triangle is very close to 2.0 Fibonacci level and also the all time high , so make sure to take some profit at that level .
let's look at the 4H chart :
in the 4H chart you can see price create W pattern and also the W pattern neck line is in alignment with the 4H resistance structure (yellow box)
if UNI succeed to break the neck line the next price target could be around 24.5$ at the next 4H structure .
🐺I hope you enjoyed this analysis.
Do not forget to like and subscribe
share my ideas with your friends , thanks for reading my idea🐺
_____________________________________
🐺 Discipline is rarely enjoyable ,
But almost always profitable 🐺
TElEGRAM CHANNEL : t.me/KIU_COIN
_____________________________________
🐺 Discipline is rarely enjoyable ,
But almost always profitable 🐺
TElEGRAM CHANNEL : t.me/KIU_COIN
_____________________________________
免责声明
这些信息和出版物并不意味着也不构成TradingView提供或认可的金融、投资、交易或其它类型的建议或背书。请在使用条款阅读更多信息。
_____________________________________
🐺 Discipline is rarely enjoyable ,
But almost always profitable 🐺
TElEGRAM CHANNEL : t.me/KIU_COIN
_____________________________________
🐺 Discipline is rarely enjoyable ,
But almost always profitable 🐺
TElEGRAM CHANNEL : t.me/KIU_COIN
_____________________________________
免责声明
这些信息和出版物并不意味着也不构成TradingView提供或认可的金融、投资、交易或其它类型的建议或背书。请在使用条款阅读更多信息。