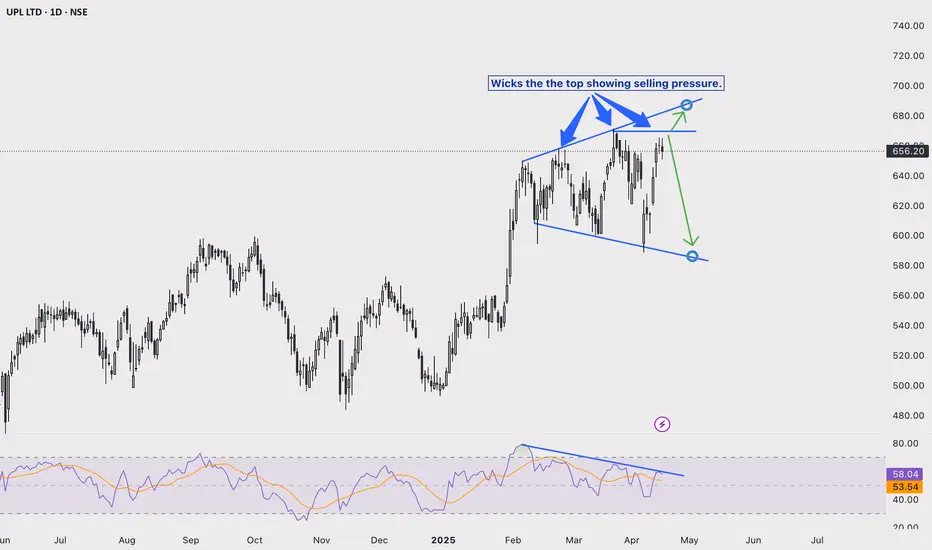
Chart analysis:- UPL
Broadening wedge pattern
This pattern may look bullish, but it has hidden bearish signs:-
1. Buyers' exhausting action. Failing to make new highs and breaking out of the last highs.
2. RSI is showing divergence. Price rising, but RSI is falling.
3. Long wicks on top showing selling pressure.
In such a case, we can see a pullback to the lower side of the wedge.
On the other hand, if it breaks out of 670, it will test the upper side of the wedge at around the 680- 685sh zone.
Buy only if the price breakout is accompanied by a volume candle and RSI breaking the level of 65+
This chart is to analyse the possible trade setup on either side of the breakout of the wedge pattern.
absoluteanalysis.in
whatsapp channel: whatsapp.com/channel/0029VanXIFTAzNbzxU4hF62L
whatsapp channel: whatsapp.com/channel/0029VanXIFTAzNbzxU4hF62L
免责声明
这些信息和出版物并不意味着也不构成TradingView提供或认可的金融、投资、交易或其它类型的建议或背书。请在使用条款阅读更多信息。
免责声明
这些信息和出版物并不意味着也不构成TradingView提供或认可的金融、投资、交易或其它类型的建议或背书。请在使用条款阅读更多信息。