📊 UPL Limited – Weekly Chart Analysis
Company Overview:
UPL Limited is a global leader in sustainable agricultural solutions, ranked among the top five agricultural solutions companies worldwide. The company operates across multiple countries, offering an integrated portfolio of patented and post-patent agricultural solutions for both arable and specialty crops — including biologicals, crop protection, seed treatment, and post-harvest solutions.
UPL is principally engaged in:
Production and sale of agrochemicals, field crops, and vegetable seeds
Non-agro business of industrial chemicals, chemical intermediates, and speciality chemicals
With market access across the world’s food basket, UPL is focused on driving growth and innovation throughout the entire agricultural value chain — from growers to distributors and partners. 🌱
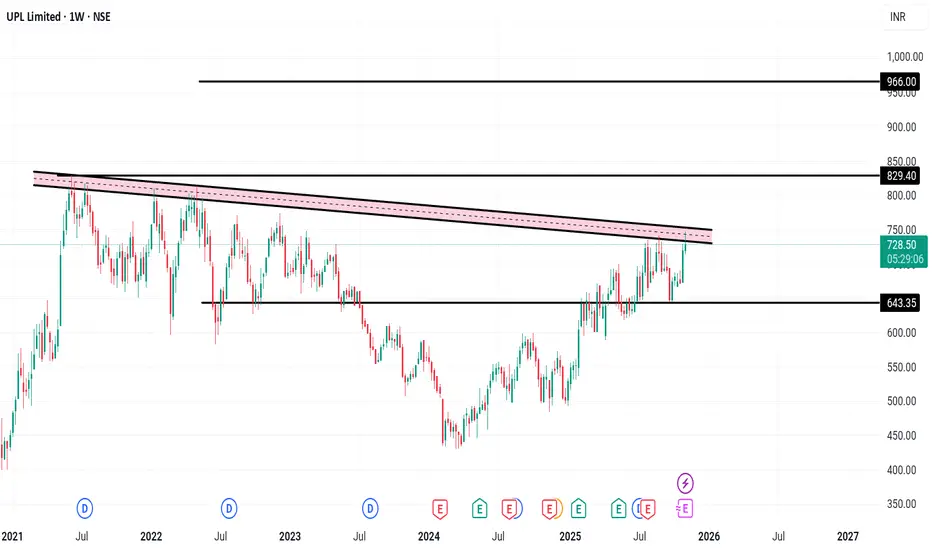
📈 Technical View (1-Week Chart):
A trendline formation is observed on the weekly timeframe, indicating a potential breakout setup.
Resistance: ₹830 – strong resistance zone. A breakout above this level can trigger the next target near ₹930.
Support: ₹643 – strong support base.
This formation suggests the move could take time to play out, as it’s developing over the weekly chart.
📊 Key Financial Snapshot:
UPL’s current market price is around ₹724.15 with a P/E ratio of 11.65. The company holds a market capitalization of ₹61,068.53 crore and offers a dividend yield of 0.83%.
In the latest quarter, net profit stood at ₹612 crore, reflecting a 125.74% increase compared to the previous quarter. Quarterly sales were ₹12,019 crore, showing an 8.38% rise. The company’s Return on Capital Employed (ROCE) is 7.66%, indicating stable operational efficiency.
Disclaimer: For educational purposes only, not investment advice
免责声明
这些信息和出版物并非旨在提供,也不构成TradingView提供或认可的任何形式的财务、投资、交易或其他类型的建议或推荐。请阅读使用条款了解更多信息。
免责声明
这些信息和出版物并非旨在提供,也不构成TradingView提供或认可的任何形式的财务、投资、交易或其他类型的建议或推荐。请阅读使用条款了解更多信息。