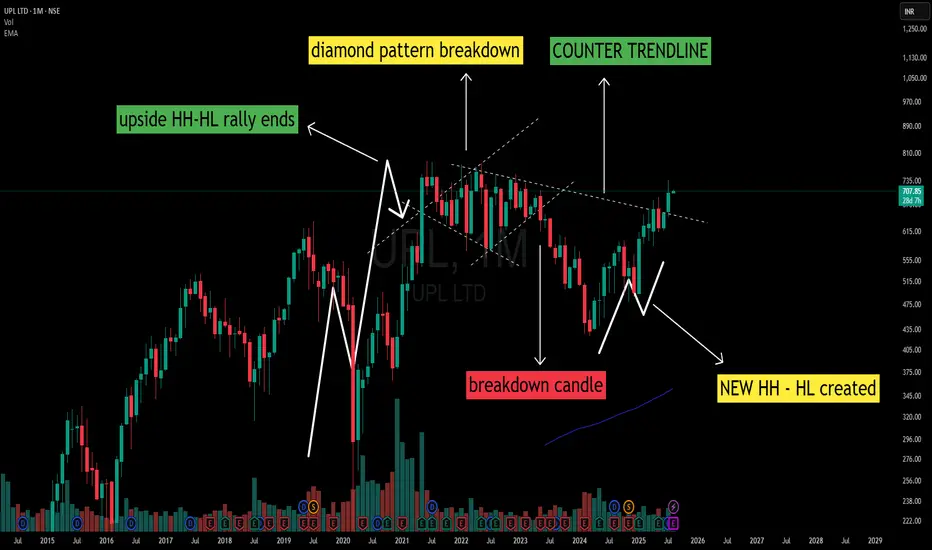
The monthly chart of UPL reflects a complete structural cycle:
1️⃣ Uptrend Phase:
A clear sequence of Higher Highs – Higher Lows (HH-HL) marked the early rally.
2️⃣ Diamond Pattern at Peak:
A diamond-shaped consolidation developed at the top of the rally, a common occurrence near trend maturity.
3️⃣ Breakdown & Downtrend:
A breakdown candle from the diamond pattern initiated a period of Lower Highs – Lower Lows (LH-LL), establishing a sustained downtrend.
4️⃣ W-Bottom Formation:
At the lower structure, a W-bottom emerged with Higher Low formation followed by a Higher High, indicating a structural shift.
5️⃣ Counter Trendline Interaction:
The earlier diamond pattern boundary has evolved into a counter trendline, now serving as an important structural reference zone.
📌 Observation:
The counter trendline remains a key structural reference on higher timeframes. This is a technical observation and not a directional view.
🎯 Master My Self-Made Trading Strategy
📈 Telegram (Learn Today): t.me/hashtaghammer
✅ WhatsApp (Learn Today): wa.me/919455664601
📈 Telegram (Learn Today): t.me/hashtaghammer
✅ WhatsApp (Learn Today): wa.me/919455664601
相关出版物
免责声明
这些信息和出版物并不意味着也不构成TradingView提供或认可的金融、投资、交易或其它类型的建议或背书。请在使用条款阅读更多信息。
🎯 Master My Self-Made Trading Strategy
📈 Telegram (Learn Today): t.me/hashtaghammer
✅ WhatsApp (Learn Today): wa.me/919455664601
📈 Telegram (Learn Today): t.me/hashtaghammer
✅ WhatsApp (Learn Today): wa.me/919455664601
相关出版物
免责声明
这些信息和出版物并不意味着也不构成TradingView提供或认可的金融、投资、交易或其它类型的建议或背书。请在使用条款阅读更多信息。