📊 General Overview
- The stock is currently trading at $50.07, showing a -1.79% daily loss.
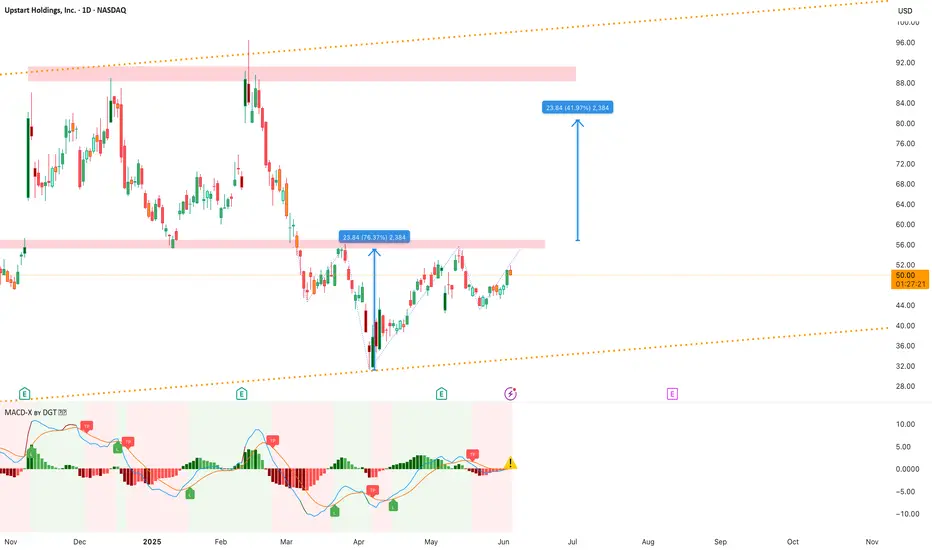
- The price is moving within an ascending channel (orange dotted lines), suggesting a long-term uptrend.
- A strong rebound since the April 2025 bottom stands out, with a 76.37% rise from lows.
🔍 Chart Patterns & Indicators
🟥 Resistance Zones and Price Targets
- The $55 range (pink zone) is acting as a strong resistance.
- A breakout above this zone may repeat the previous move upward ($23.84 gain / +41.97%), targeting the $80 level.
🔻 Reverse Head and Shoulders Recovery Pattern
- The sharp drop and rapid rebound formed a V-bottom, often signaling strong reversals and bullish momentum.
- This is reinforced by increasing higher lows since April.
📈 Ascending Channel
- The price is clearly respecting the ascending channel boundaries.
- The lower orange dotted line acts as dynamic support, while the upper line may - define the next ceiling near $95–100.
📊 MACD Indicator (Momentum)
- The MACD lines are about to cross upward in the positive region—an early bullish momentum signal.
- However, a yellow warning symbol indicates possible caution due to increased volatility or overbought conditions.
🎯 Strategy & Expectations
- The $50–55 area is a critical resistance zone to watch.
- A successful breakout above $55 could technically extend the move toward $80.
- Confirmation from MACD and volume spikes would strengthen the bullish case.
- A stop-loss below $45 can be considered if the price gets rejected again at resistance.
- The stock is currently trading at $50.07, showing a -1.79% daily loss.
- The price is moving within an ascending channel (orange dotted lines), suggesting a long-term uptrend.
- A strong rebound since the April 2025 bottom stands out, with a 76.37% rise from lows.
🔍 Chart Patterns & Indicators
🟥 Resistance Zones and Price Targets
- The $55 range (pink zone) is acting as a strong resistance.
- A breakout above this zone may repeat the previous move upward ($23.84 gain / +41.97%), targeting the $80 level.
🔻 Reverse Head and Shoulders Recovery Pattern
- The sharp drop and rapid rebound formed a V-bottom, often signaling strong reversals and bullish momentum.
- This is reinforced by increasing higher lows since April.
📈 Ascending Channel
- The price is clearly respecting the ascending channel boundaries.
- The lower orange dotted line acts as dynamic support, while the upper line may - define the next ceiling near $95–100.
📊 MACD Indicator (Momentum)
- The MACD lines are about to cross upward in the positive region—an early bullish momentum signal.
- However, a yellow warning symbol indicates possible caution due to increased volatility or overbought conditions.
🎯 Strategy & Expectations
- The $50–55 area is a critical resistance zone to watch.
- A successful breakout above $55 could technically extend the move toward $80.
- Confirmation from MACD and volume spikes would strengthen the bullish case.
- A stop-loss below $45 can be considered if the price gets rejected again at resistance.
注释
This was more than just a typical pullbackIt initially broke above resistance and turned it into support.
But the pullback was so aggressive that it broke back below that support.
And now, we've broken that level yet again.
At this point, it’s clear that this zone no longer acts as reliable support. The market has shown that it can break through it from both directions, undermining its strength as a key level.
Anyway, our target is now under radar.
交易结束:到达目标
Buy: 50Sell: 80
60% in four weeks.
Planning to trade it again soon.
免责声明
这些信息和出版物并不意味着也不构成TradingView提供或认可的金融、投资、交易或其它类型的建议或背书。请在使用条款阅读更多信息。