📈 US100 – Likely Bullish Gap at Open Followed by a Sharp Drop 📉
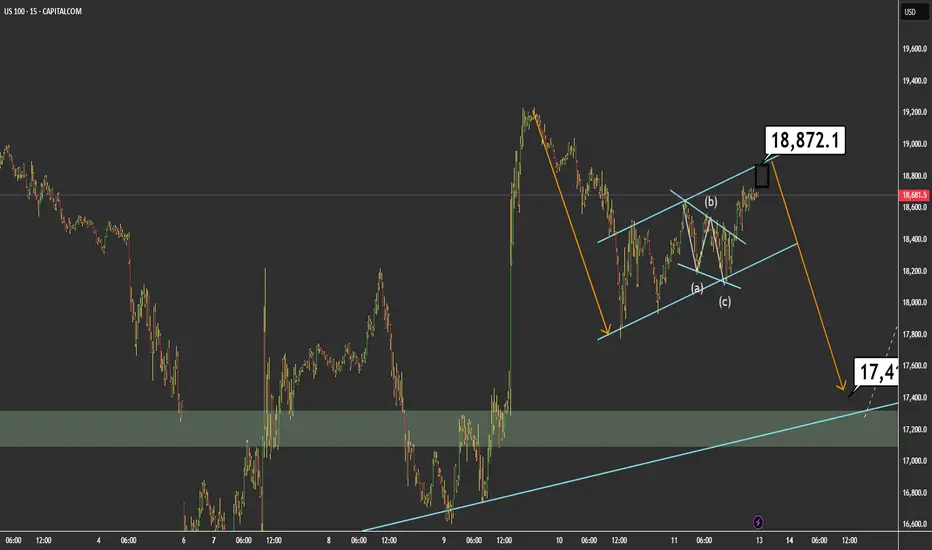
On the 15-minute chart of the US100, we can see a corrective structure forming within an ascending channel, likely representing wave (B) of a larger correction. The price is currently near the top boundary of the channel, around 18,872.1.
🔍 Key Technical Highlights:
Clear prior bearish impulse.
Ongoing corrective move within a rising channel.
ABC correction forming inside the channel.
Potential rising wedge, suggesting bullish exhaustion.
📌 Main Hypothesis: I expect the market to open with a bullish gap, potentially reaching or briefly exceeding the 18,872.1 level, before starting a stronger downward move toward 17,411.8, which aligns with a key support zone and broader trendline confluence.
📊 Key Levels:
Resistance: 18,872.1 (ideal reversal area)
Target Support: 17,411.8
⚠️ Alternative Scenario: A strong breakout and consolidation above the channel could invalidate the bearish setup and suggest a continuation to the upside.
💡 Conclusion: This move would fit well within a broader corrective pattern, offering a technical pullback before any potential continuation. I’ll be watching the open closely for confirmation.
💼 Trade Idea:
🔹 Strategy: Short from resistance
🔹 Suggested Entry: 18,850 – 18,880 (potential gap zone and upper channel resistance)
🔹 Stop Loss: Above 18,920 (outside channel and above recent highs)
🔹 Take Profit: 17,500 – 17,450 (key support zone / technical target)
🔹 Risk/Reward Approximation: 1:4
🧠 Wait for price action confirmation (rejection, bearish engulfing candle, or intraday structure break before entering).
注释
注释
注释
注释
注释
免责声明
这些信息和出版物并非旨在提供,也不构成TradingView提供或认可的任何形式的财务、投资、交易或其他类型的建议或推荐。请阅读使用条款了解更多信息。
免责声明
这些信息和出版物并非旨在提供,也不构成TradingView提供或认可的任何形式的财务、投资、交易或其他类型的建议或推荐。请阅读使用条款了解更多信息。