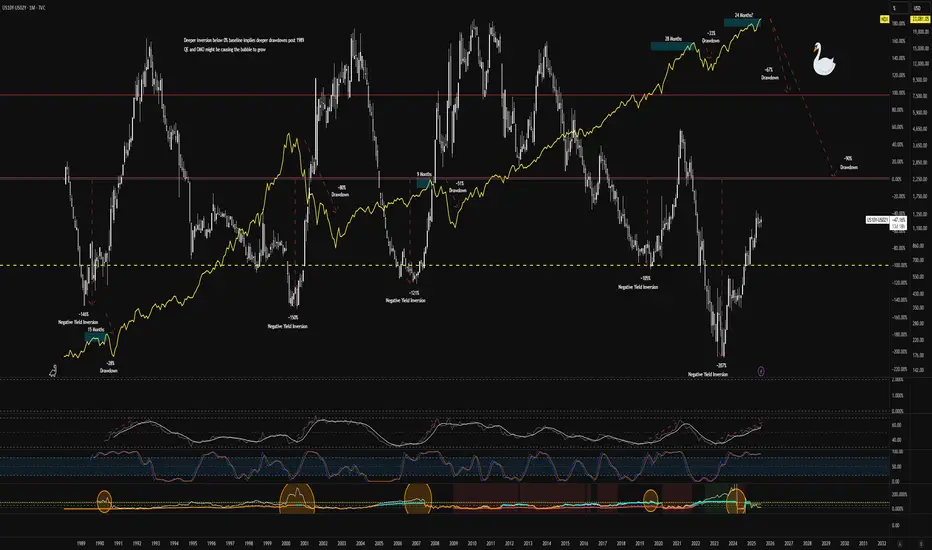
It appears that since 1989, deeper inversions of the yield curve have led to deeper drawdowns in the $NDX. Relative strength always appears to be in a steeper move upward coupled with fuzzy signals in volatility before the drawdown. Based on the previous market crashes, anything from a 60% to 90% drawdown appears to be plausible.
Currently buying long-expiry OTM put verticals across tech meme names (think PLTR) and potentially on some stalwart Mag7 tickers (maybe
  META) for pennies for potentially massive risk/reward paydays. Nothing more than a few grand, but I'm also long exposure to battery materials, hydrogen, and other energy plays.
  ABAT
ABAT  PLUG
PLUG  WWR
WWR  LAC
LAC  ENVX
ENVX  CHPT
CHPT  LEU
LEU  SMR
SMR
Best of luck.
Currently buying long-expiry OTM put verticals across tech meme names (think
Best of luck.
免责声明
这些信息和出版物并不意味着也不构成TradingView提供或认可的金融、投资、交易或其它类型的建议或背书。请在使用条款阅读更多信息。
免责声明
这些信息和出版物并不意味着也不构成TradingView提供或认可的金融、投资、交易或其它类型的建议或背书。请在使用条款阅读更多信息。