Sharing my outlook on the Dow, which aligns with my NASDAQ analysis but with a specific mathematical approach. 📊
**🎯 The Setup:**
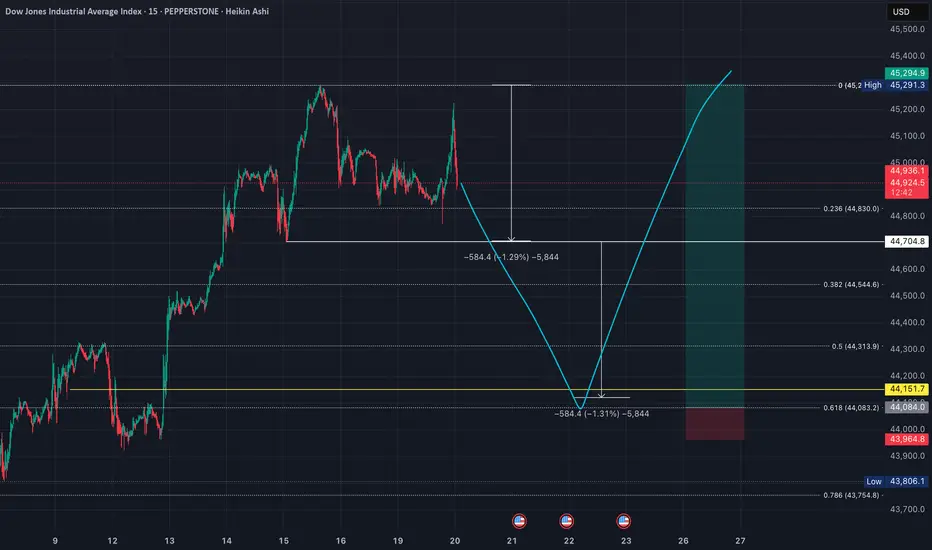
I'm targeting a long position based on an equal leg projection. Taking the range from the recent low to the all-time high, I expect a decline equal to that same distance. This projection perfectly coincides with the 0.618 Fibonacci level - a powerful confluence. 🎯
**📍 Entry Strategy:**
The beauty of this setup is the mathematical precision: the equal leg down from the high lands exactly at the 0.618 Fib level. This confluence gives me high confidence in this support zone for a potential long entry. ✅
**⚠️ Risk Management:**
Stop loss would be placed below the projected low, targeting new all-time highs. Clean entry, clear invalidation level. 🛑
**🧠 Why This Works:**
Equal leg projections are powerful tools in market analysis. When combined with key Fibonacci levels, they create high-probability reversal zones. The market often respects these mathematical relationships. 📐
**🔄 Bigger Picture Alignment:**
This setup aligns with my broader market view - expecting one final push higher before any significant correction. The Dow's equal leg projection gives us a precise entry point for this bullish thesis. 📈
**💡 Key Insight:**
When geometric projections align with Fibonacci levels, it creates what I call "mathematical harmony" in the markets. These setups often provide the best risk-adjusted opportunities. 🎵
📈 **This trade setup offers a risk-to-reward ratio of 10:1.** Without including fees, the breakeven win rate for this trade would be approximately 9.09%. Knowing these figures in advance helps me avoid emotional trading. 🧠
💡 **Pro Tip**: If you often find yourself trading based on emotions, I recommend doing this type of pre-planning and quantifying your setups before execution — it can be a simple yet highly effective improvement. ✅
---
**Trading is simple.** You don't need multiple indicators or dozens of lines on your chart. A clean and simple chart often works best — it keeps your decisions consistent and reduces uncertainty. Sure, it might not look flashy, and my analysis may seem a bit "plain" compared to others… but that's how I like it. If you find this analysis useful, feel free to follow me for more updates.
---
*Disclaimer: This post is for general informational and educational purposes only. It does not constitute financial advice, investment recommendation, or a service targeting specific investors, and should not be considered illegal or restricted information in any jurisdiction.*
**🎯 The Setup:**
I'm targeting a long position based on an equal leg projection. Taking the range from the recent low to the all-time high, I expect a decline equal to that same distance. This projection perfectly coincides with the 0.618 Fibonacci level - a powerful confluence. 🎯
**📍 Entry Strategy:**
The beauty of this setup is the mathematical precision: the equal leg down from the high lands exactly at the 0.618 Fib level. This confluence gives me high confidence in this support zone for a potential long entry. ✅
**⚠️ Risk Management:**
Stop loss would be placed below the projected low, targeting new all-time highs. Clean entry, clear invalidation level. 🛑
**🧠 Why This Works:**
Equal leg projections are powerful tools in market analysis. When combined with key Fibonacci levels, they create high-probability reversal zones. The market often respects these mathematical relationships. 📐
**🔄 Bigger Picture Alignment:**
This setup aligns with my broader market view - expecting one final push higher before any significant correction. The Dow's equal leg projection gives us a precise entry point for this bullish thesis. 📈
**💡 Key Insight:**
When geometric projections align with Fibonacci levels, it creates what I call "mathematical harmony" in the markets. These setups often provide the best risk-adjusted opportunities. 🎵
📈 **This trade setup offers a risk-to-reward ratio of 10:1.** Without including fees, the breakeven win rate for this trade would be approximately 9.09%. Knowing these figures in advance helps me avoid emotional trading. 🧠
💡 **Pro Tip**: If you often find yourself trading based on emotions, I recommend doing this type of pre-planning and quantifying your setups before execution — it can be a simple yet highly effective improvement. ✅
---
**Trading is simple.** You don't need multiple indicators or dozens of lines on your chart. A clean and simple chart often works best — it keeps your decisions consistent and reduces uncertainty. Sure, it might not look flashy, and my analysis may seem a bit "plain" compared to others… but that's how I like it. If you find this analysis useful, feel free to follow me for more updates.
---
*Disclaimer: This post is for general informational and educational purposes only. It does not constitute financial advice, investment recommendation, or a service targeting specific investors, and should not be considered illegal or restricted information in any jurisdiction.*
订单已取消
The overall situation looks much worse than expected, so I canceled my orders for now.免责声明
这些信息和出版物并不意味着也不构成TradingView提供或认可的金融、投资、交易或其它类型的建议或背书。请在使用条款阅读更多信息。
免责声明
这些信息和出版物并不意味着也不构成TradingView提供或认可的金融、投资、交易或其它类型的建议或背书。请在使用条款阅读更多信息。