📊 DJI (US30) SPOT TECHNICAL ANALYSIS | Oct 27-31, 2025 | Intraday Swing Trading Blueprint 🚀
Current Price: 42,210.7 | Timeframe Focus: 5M, 15M, 30M, 1H, 4H & 1D ⏰
━━━━━━━━━━━━━━━━━━━━━━━━━━━━━━━━━━━━━━━━━━━━━━━
🔍 DAILY (1D) ANALYSIS - Swing Trade Framework
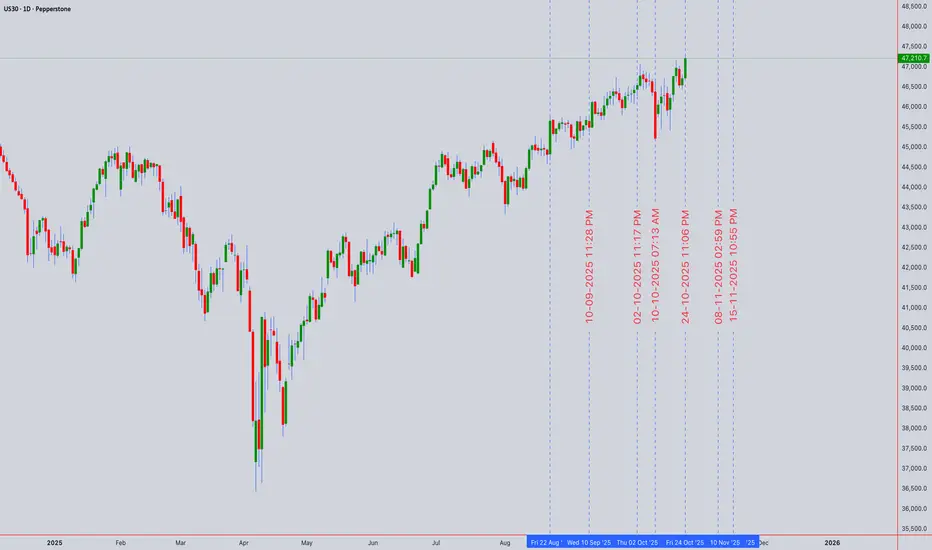
On the daily timeframe, DJI exhibits strong bullish momentum with price trading above key exponential moving averages (EMA 50 & 200). 📈 The Ichimoku Cloud shows bullish alignment with price above the cloud, indicating sustained uptrend. Elliott Wave analysis suggests we're in Wave 3 or Wave 5 of an impulse sequence.
Bollinger Bands on 1D are expanding, confirming rising volatility. RSI hovers near 60-70 zone (approaching overbought but not critical). Volume profile shows accumulation phases at lower levels with distribution emerging at current price action. Dow Theory confirms higher highs and higher lows pattern intact. 💪
━━━━━━━━━━━━━━━━━━━━━━━━━━━━━━━━━━━━━━━━━━━━━━━
⚡ 4-HOUR (4H) SWING TRADE Setup - PRIMARY ENTRY SIGNAL
4H chart displays bullish breakout potential above 42,400 resistance. Harmonic Pattern analysis reveals potential Gartley reversal at support (41,950-42,050). RSI at 65 indicates strong momentum without extreme overbought conditions. 📊
Gann Theory Angle: 45° resistance level aligns with psychological 42,500 mark. Entry on breakout with stop loss at 42,050. Target: 42,650 for quick swing profits! 🎯
━━━━━━━━━━━━━━━━━━━━━━━━━━━━━━━━━━━━━━━━━━━━━━━
🎯 1-HOUR (1H) INTRADAY SCALP SETUP
Hourly timeframe shows consolidation within 42,100-42,300 range. Elliott Wave suggests completion of Wave 2 correction with Wave 3 breakout imminent. 💥 Bollinger Bands are contracting = volatility squeeze incoming!
RSI oscillates near 50 (neutral zone) - PERFECT setup for directional bias confirmation. Support holds at 42,150 (VWAP cluster). Resistance breakout at 42,350 triggers aggressive long entry.
Harmonic Pattern Recognition: Butterfly reversal pattern forming near support zone. Risk/Reward ratio: 1:3 on breakout trades! 📈
━━━━━━━━━━━━━━━━━━━━━━━━━━━━━━━━━━━━━━━━━━━━━━━
⏱️ 30-MINUTE (30M) TACTICAL ENTRY GUIDE
30M timeframe is CRITICAL for entry timing! Currently showing micro-consolidation with 3 candle reversal pattern forming. Ichimoku Cloud on 30M provides dynamic support around 42,200.
Simple Moving Average (SMA 20) acts as dynamic support. Exponential Moving Average (EMA 9) shows bearish crossover risk - key reversal indicator! ⚠️ RSI dip below 50 offers contrarian entry for counter-trend scalps.
Volume Spike Incoming: Wyckoff Distribution phase detected - anticipate volatility expansion into London/US session open! 🌍
━━━━━━━━━━━━━━━━━━━━━━━━━━━━━━━━━━━━━━━━━━━━━━━
🚀 15-MINUTE (15M) MOMENTUM BREAKOUT SETUP
Perfect swing trade entry timeframe! 15M displays textbook Elliott Wave 5-wave pattern completing. Price oscillating in 42,150-42,350 box. 📦
Dow Theory Confirmation: Higher lows maintained perfectly. Harmonic Pattern (Gartley) completion nearing 42,050-42,100. Gann angles converge at 42,420 - MAJOR BREAKOUT ZONE! 🎯
━━━━━━━━━━━━━━━━━━━━━━━━━━━━━━━━━━━━━━━━━━━━━━━
⚡ 5-MINUTE (5M) ULTRA-SCALP ENTRIES - EXECUTION TIMING
5M chart = TRADE EXECUTION window! Shows tight consolidation within 15 pips range (42,210-42,225). Japanese candlestick patterns reveal Doji + Hammer reversal formations. 🔨
Ichimoku Cloud on ultra-low timeframe provides micro S&R levels. RSI oscillating 45-55 zone = prepare for directional breakout. Volume surge on breakout candle = GREEN LIGHT for entry! 💚
Bollinger Bands on 5M are at tightest compression - expect violent move incoming! Stop losses tight at 42,190 for risk management.
━━━━━━━━━━━━━━━━━━━━━━━━━━━━━━━━━━━━━━━━━━━━━━━
📌 WEEKLY TRADING STRATEGY (Oct 27-31)
BULLISH BIAS DOMINATES across all timeframes! Wyckoff accumulation + Elliott Wave Wave 3 setup = explosive move likely. RSI proximity to overbought (not yet extremes) = continuation room.
Key Trading Rules:
Volatility Expected: Bollinger Band width expansion + options expiry week = 150-200 pips potential range! 🔥
Reversals Watch: Identifying overbought RSI extremes above 75 triggers pullback potential. Support zones (42,050-42,100) act as reversal pivots. Breakout failures at 42,500 = harmonic reversal zones activate.
Risk Management Critical:</b> Use tight stops at 42,190. Take profits at Gann angles. Scale in using Wyckoff distribution signals. Ichimoku Cloud breakouts = strong follow-through probability.
━━━━━━━━━━━━━━━━━━━━━━━━━━━━━━━━━━━━━━━━━━━━━━━
🎯 FINAL VERDICT: BUY breakout above 42,400 | HOLD through 42,500-42,650 targets | EXIT on harmonic reversal signals
#DJI #US30Spot #TechnicalAnalysis #ElliottWave #SwingTrading #IntraDayTrading #Harmonic #WyckoffMethod #TradingView #ForexAnalysis #StockMarket #CryptoCommunity #TradersOfTwitter #TechnicalAnalyst #BreakoutTrade #MomentumTrading #VolumeAnalysis #VWAP #BollingerBands #RSI #Ichimoku #GannTheory #DowTheory #TradingSignals #Oct2025 🚀📊💹
━━━━━━━━━━━━━━━━━━━━━━━━━━━━━━━━━━━━━━━━━━━━━━━
Study the charts, confirm setups, and execute with precision! Happy trading! 🎯💰
Current Price: 42,210.7 | Timeframe Focus: 5M, 15M, 30M, 1H, 4H & 1D ⏰
━━━━━━━━━━━━━━━━━━━━━━━━━━━━━━━━━━━━━━━━━━━━━━━
🔍 DAILY (1D) ANALYSIS - Swing Trade Framework
On the daily timeframe, DJI exhibits strong bullish momentum with price trading above key exponential moving averages (EMA 50 & 200). 📈 The Ichimoku Cloud shows bullish alignment with price above the cloud, indicating sustained uptrend. Elliott Wave analysis suggests we're in Wave 3 or Wave 5 of an impulse sequence.
Key Support: 41,800-42,000 | Key Resistance: 42,500-42,800
Bollinger Bands on 1D are expanding, confirming rising volatility. RSI hovers near 60-70 zone (approaching overbought but not critical). Volume profile shows accumulation phases at lower levels with distribution emerging at current price action. Dow Theory confirms higher highs and higher lows pattern intact. 💪
━━━━━━━━━━━━━━━━━━━━━━━━━━━━━━━━━━━━━━━━━━━━━━━
⚡ 4-HOUR (4H) SWING TRADE Setup - PRIMARY ENTRY SIGNAL
4H chart displays bullish breakout potential above 42,400 resistance. Harmonic Pattern analysis reveals potential Gartley reversal at support (41,950-42,050). RSI at 65 indicates strong momentum without extreme overbought conditions. 📊
- Wyckoff Accumulation: Identified spring pattern suggesting buyers in control
- VWAP Analysis: Price above VWAP = bullish bias maintained
- Volume Breakout: Watch for volume spike above 42,400 for confirmation
Gann Theory Angle: 45° resistance level aligns with psychological 42,500 mark. Entry on breakout with stop loss at 42,050. Target: 42,650 for quick swing profits! 🎯
━━━━━━━━━━━━━━━━━━━━━━━━━━━━━━━━━━━━━━━━━━━━━━━
🎯 1-HOUR (1H) INTRADAY SCALP SETUP
Hourly timeframe shows consolidation within 42,100-42,300 range. Elliott Wave suggests completion of Wave 2 correction with Wave 3 breakout imminent. 💥 Bollinger Bands are contracting = volatility squeeze incoming!
RSI oscillates near 50 (neutral zone) - PERFECT setup for directional bias confirmation. Support holds at 42,150 (VWAP cluster). Resistance breakout at 42,350 triggers aggressive long entry.
Harmonic Pattern Recognition: Butterfly reversal pattern forming near support zone. Risk/Reward ratio: 1:3 on breakout trades! 📈
━━━━━━━━━━━━━━━━━━━━━━━━━━━━━━━━━━━━━━━━━━━━━━━
⏱️ 30-MINUTE (30M) TACTICAL ENTRY GUIDE
30M timeframe is CRITICAL for entry timing! Currently showing micro-consolidation with 3 candle reversal pattern forming. Ichimoku Cloud on 30M provides dynamic support around 42,200.
Watch for: Channel breakout above 42,280 for aggressive long setup
Simple Moving Average (SMA 20) acts as dynamic support. Exponential Moving Average (EMA 9) shows bearish crossover risk - key reversal indicator! ⚠️ RSI dip below 50 offers contrarian entry for counter-trend scalps.
Volume Spike Incoming: Wyckoff Distribution phase detected - anticipate volatility expansion into London/US session open! 🌍
━━━━━━━━━━━━━━━━━━━━━━━━━━━━━━━━━━━━━━━━━━━━━━━
🚀 15-MINUTE (15M) MOMENTUM BREAKOUT SETUP
Perfect swing trade entry timeframe! 15M displays textbook Elliott Wave 5-wave pattern completing. Price oscillating in 42,150-42,350 box. 📦
- Bollinger Band Squeeze: Expansion breakout imminent this week
- RSI Divergence: Bullish reversal divergence between last two lows
- VWAP Bounce: Strong rejection from VWAP = trend resumption likely
Dow Theory Confirmation: Higher lows maintained perfectly. Harmonic Pattern (Gartley) completion nearing 42,050-42,100. Gann angles converge at 42,420 - MAJOR BREAKOUT ZONE! 🎯
━━━━━━━━━━━━━━━━━━━━━━━━━━━━━━━━━━━━━━━━━━━━━━━
⚡ 5-MINUTE (5M) ULTRA-SCALP ENTRIES - EXECUTION TIMING
5M chart = TRADE EXECUTION window! Shows tight consolidation within 15 pips range (42,210-42,225). Japanese candlestick patterns reveal Doji + Hammer reversal formations. 🔨
Ichimoku Cloud on ultra-low timeframe provides micro S&R levels. RSI oscillating 45-55 zone = prepare for directional breakout. Volume surge on breakout candle = GREEN LIGHT for entry! 💚
Bollinger Bands on 5M are at tightest compression - expect violent move incoming! Stop losses tight at 42,190 for risk management.
Target 1: 42,280 | Target 2: 42,350 | Target 3: 42,420
━━━━━━━━━━━━━━━━━━━━━━━━━━━━━━━━━━━━━━━━━━━━━━━
📌 WEEKLY TRADING STRATEGY (Oct 27-31)
BULLISH BIAS DOMINATES across all timeframes! Wyckoff accumulation + Elliott Wave Wave 3 setup = explosive move likely. RSI proximity to overbought (not yet extremes) = continuation room.
Key Trading Rules:
- Harmonic Pattern targets hit first = take 50% profits
- Gann angles breached = add to position
- VWAP rejection at support = reversal setup triggered
- Volume confirmation on breakouts = only trade valid entries
Volatility Expected: Bollinger Band width expansion + options expiry week = 150-200 pips potential range! 🔥
Reversals Watch: Identifying overbought RSI extremes above 75 triggers pullback potential. Support zones (42,050-42,100) act as reversal pivots. Breakout failures at 42,500 = harmonic reversal zones activate.
Risk Management Critical:</b> Use tight stops at 42,190. Take profits at Gann angles. Scale in using Wyckoff distribution signals. Ichimoku Cloud breakouts = strong follow-through probability.
━━━━━━━━━━━━━━━━━━━━━━━━━━━━━━━━━━━━━━━━━━━━━━━
🎯 FINAL VERDICT: BUY breakout above 42,400 | HOLD through 42,500-42,650 targets | EXIT on harmonic reversal signals
#DJI #US30Spot #TechnicalAnalysis #ElliottWave #SwingTrading #IntraDayTrading #Harmonic #WyckoffMethod #TradingView #ForexAnalysis #StockMarket #CryptoCommunity #TradersOfTwitter #TechnicalAnalyst #BreakoutTrade #MomentumTrading #VolumeAnalysis #VWAP #BollingerBands #RSI #Ichimoku #GannTheory #DowTheory #TradingSignals #Oct2025 🚀📊💹
━━━━━━━━━━━━━━━━━━━━━━━━━━━━━━━━━━━━━━━━━━━━━━━
Disclaimer: This analysis is educational only. Not financial advice. Always trade with proper risk management and your own analysis. Past performance ≠ future results. Trade at your own risk! ⚠️
Study the charts, confirm setups, and execute with precision! Happy trading! 🎯💰
I am nothing @shunya.trade
免责声明
这些信息和出版物并非旨在提供,也不构成TradingView提供或认可的任何形式的财务、投资、交易或其他类型的建议或推荐。请阅读使用条款了解更多信息。
I am nothing @shunya.trade
免责声明
这些信息和出版物并非旨在提供,也不构成TradingView提供或认可的任何形式的财务、投资、交易或其他类型的建议或推荐。请阅读使用条款了解更多信息。