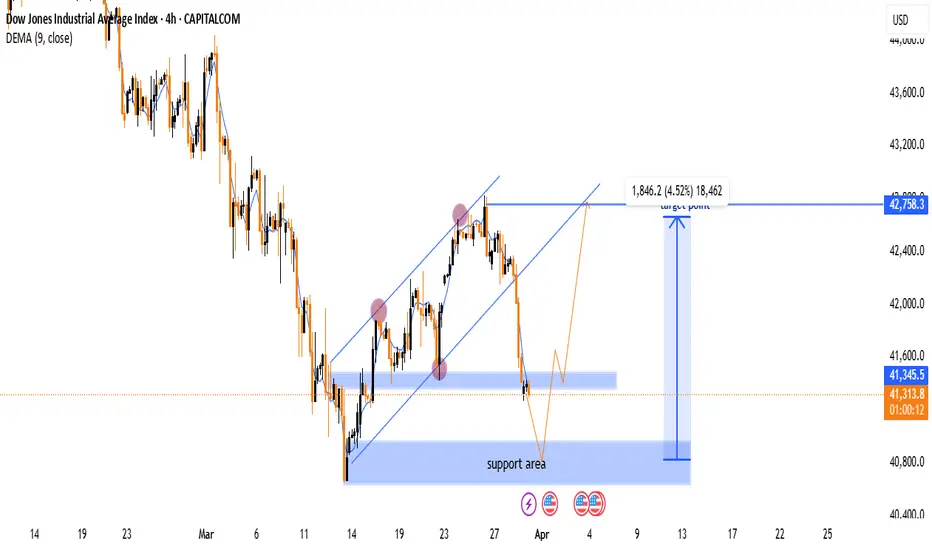
📉 Downtrend: The price was falling sharply before forming an upward channel.
📊 Channel Break: The price broke below the ascending channel 🚨.
🟦 Support Zone: The blue area marks a strong support region 📌.
🔵 Bounce Expected? If the price holds, a rebound could happen 📈.
🎯 Target: The projected upside target is 42,758.3 🚀.
⚠️ Risk: If the support fails, the price may drop further ⛔.
🔴 Watch for: A confirmed reversal near support or further breakdown!
join my tellegram channel
t.me/+yhY0QtYtM0g0NWM0
join my refferal broker
one.exnesstrack.org/a/g565sj1uo7?source=app
t.me/+yhY0QtYtM0g0NWM0
join my refferal broker
one.exnesstrack.org/a/g565sj1uo7?source=app
免责声明
这些信息和出版物并非旨在提供,也不构成TradingView提供或认可的任何形式的财务、投资、交易或其他类型的建议或推荐。请阅读使用条款了解更多信息。
join my tellegram channel
t.me/+yhY0QtYtM0g0NWM0
join my refferal broker
one.exnesstrack.org/a/g565sj1uo7?source=app
t.me/+yhY0QtYtM0g0NWM0
join my refferal broker
one.exnesstrack.org/a/g565sj1uo7?source=app
免责声明
这些信息和出版物并非旨在提供,也不构成TradingView提供或认可的任何形式的财务、投资、交易或其他类型的建议或推荐。请阅读使用条款了解更多信息。