We have seen mixed price action for the last four days, with rallies finding sellers and dips finding buyers
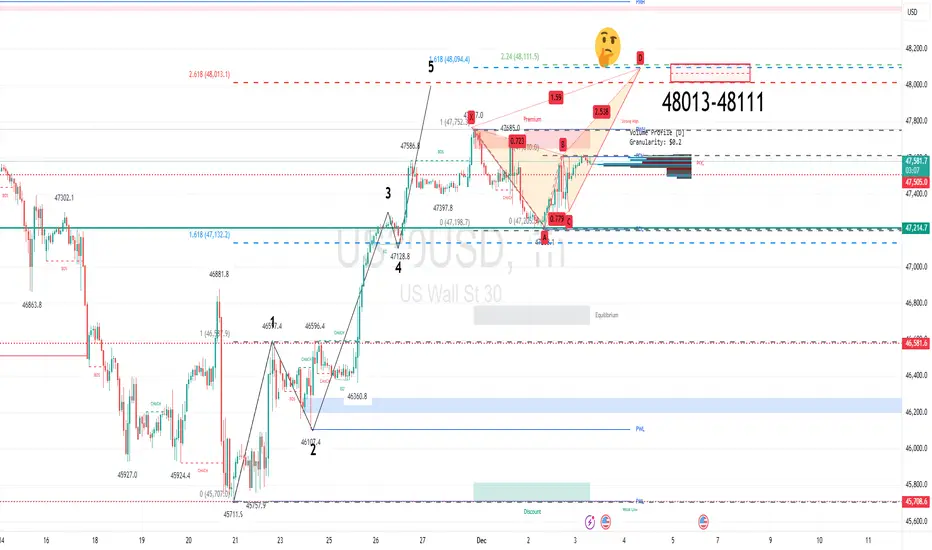
The intraday chart highlights a 261.8% extension level at 48,013. A move to this zone would be analysed as the completion of a bullish 5 Wave count (Elliott Wave).
The current mixed daily results look to be forming a Crab pattern. That will be completed on a move to 48,111.
Conclusion: the medium-term bias is bearish. The preferred stance would be to sell into rallies within the 48,013-48,111 zone.
Please ask me for a current Discord link
免责声明
这些信息和出版物并非旨在提供,也不构成TradingView提供或认可的任何形式的财务、投资、交易或其他类型的建议或推荐。请阅读使用条款了解更多信息。
Please ask me for a current Discord link
免责声明
这些信息和出版物并非旨在提供,也不构成TradingView提供或认可的任何形式的财务、投资、交易或其他类型的建议或推荐。请阅读使用条款了解更多信息。