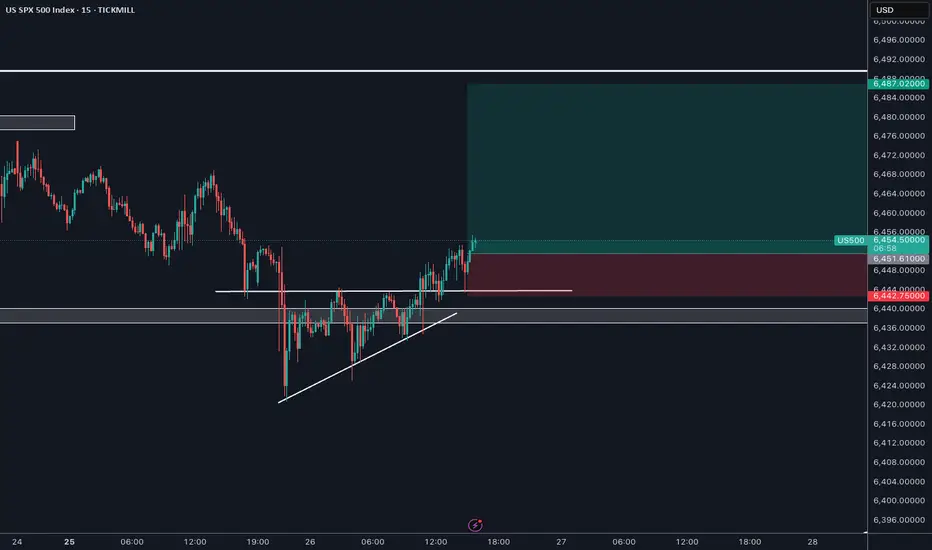
The US500 reached a key support area on the H1 chart and started building a bullish structure.
On the intraday (M5/M1), price broke above local resistance and then retested the breakout zone with a clean pullback. This retest was confirmed by a strong bullish candle, signaling continuation to the upside.
Trade plan:
Entry: after confirmation of the pullback at the breakout zone.
Stop-loss: below support (around 6437).
Target: all-time high zone at 6485–6490.
Risk management: once the first target is reached, stop can be moved to breakeven to protect capital.
This setup supports the expectation of bullish continuation, as long as support holds.
免责声明
这些信息和出版物并非旨在提供,也不构成TradingView提供或认可的任何形式的财务、投资、交易或其他类型的建议或推荐。请阅读使用条款了解更多信息。
免责声明
这些信息和出版物并非旨在提供,也不构成TradingView提供或认可的任何形式的财务、投资、交易或其他类型的建议或推荐。请阅读使用条款了解更多信息。