Macro Dashboard: Growth, Inflation, and Market Sentiment
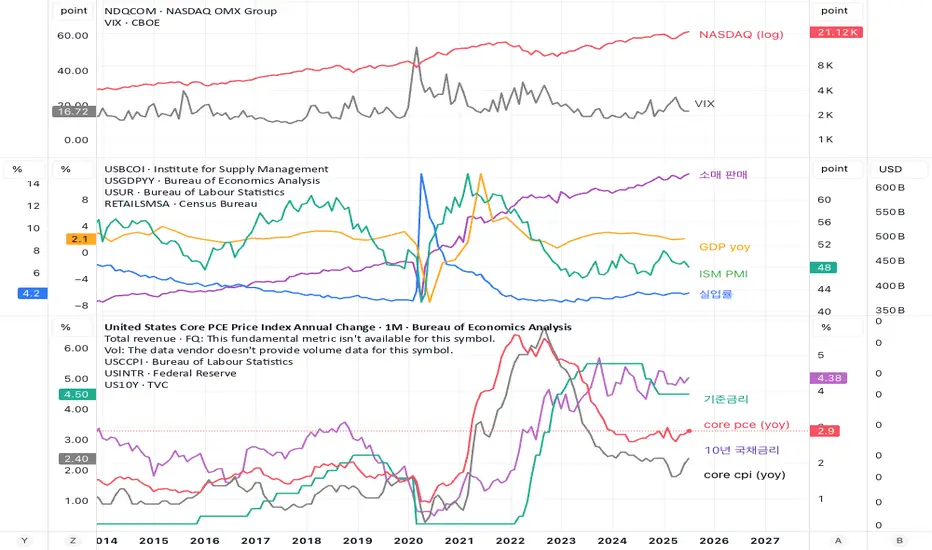
This set of three charts provides a concise overview of the U.S. macroeconomic landscape, grouped into three key categories:
Market Sentiment
NASDAQ, VIX
Captures risk appetite and volatility in equity markets. NASDAQ reflects growth and tech-sector momentum, while VIX indicates fear and uncertainty.
Economic Activity
Retail Sales, GDP YoY, ISM PMI, Unemployment Rate
Tracks the pulse of the real economy. Retail sales and ISM PMI show consumer and business activity, GDP YoY highlights overall growth, and unemployment measures labor market strength.
Monetary Policy & Inflation
Fed Funds Rate, Core PCE YoY, Core CPI YoY, 10Y Treasury Yield
Monitors the Federal Reserve’s policy stance and inflation dynamics. Core PCE and Core CPI are key inflation measures, while the 10-year yield reflects market expectations for growth and policy.
Together, these charts help visualize how economic fundamentals, inflation, and market sentiment interact — a practical dashboard for understanding U.S. macro conditions and their impact on financial markets.
免责声明
这些信息和出版物并不意味着也不构成TradingView提供或认可的金融、投资、交易或其它类型的建议或背书。请在使用条款阅读更多信息。